Panel Layout
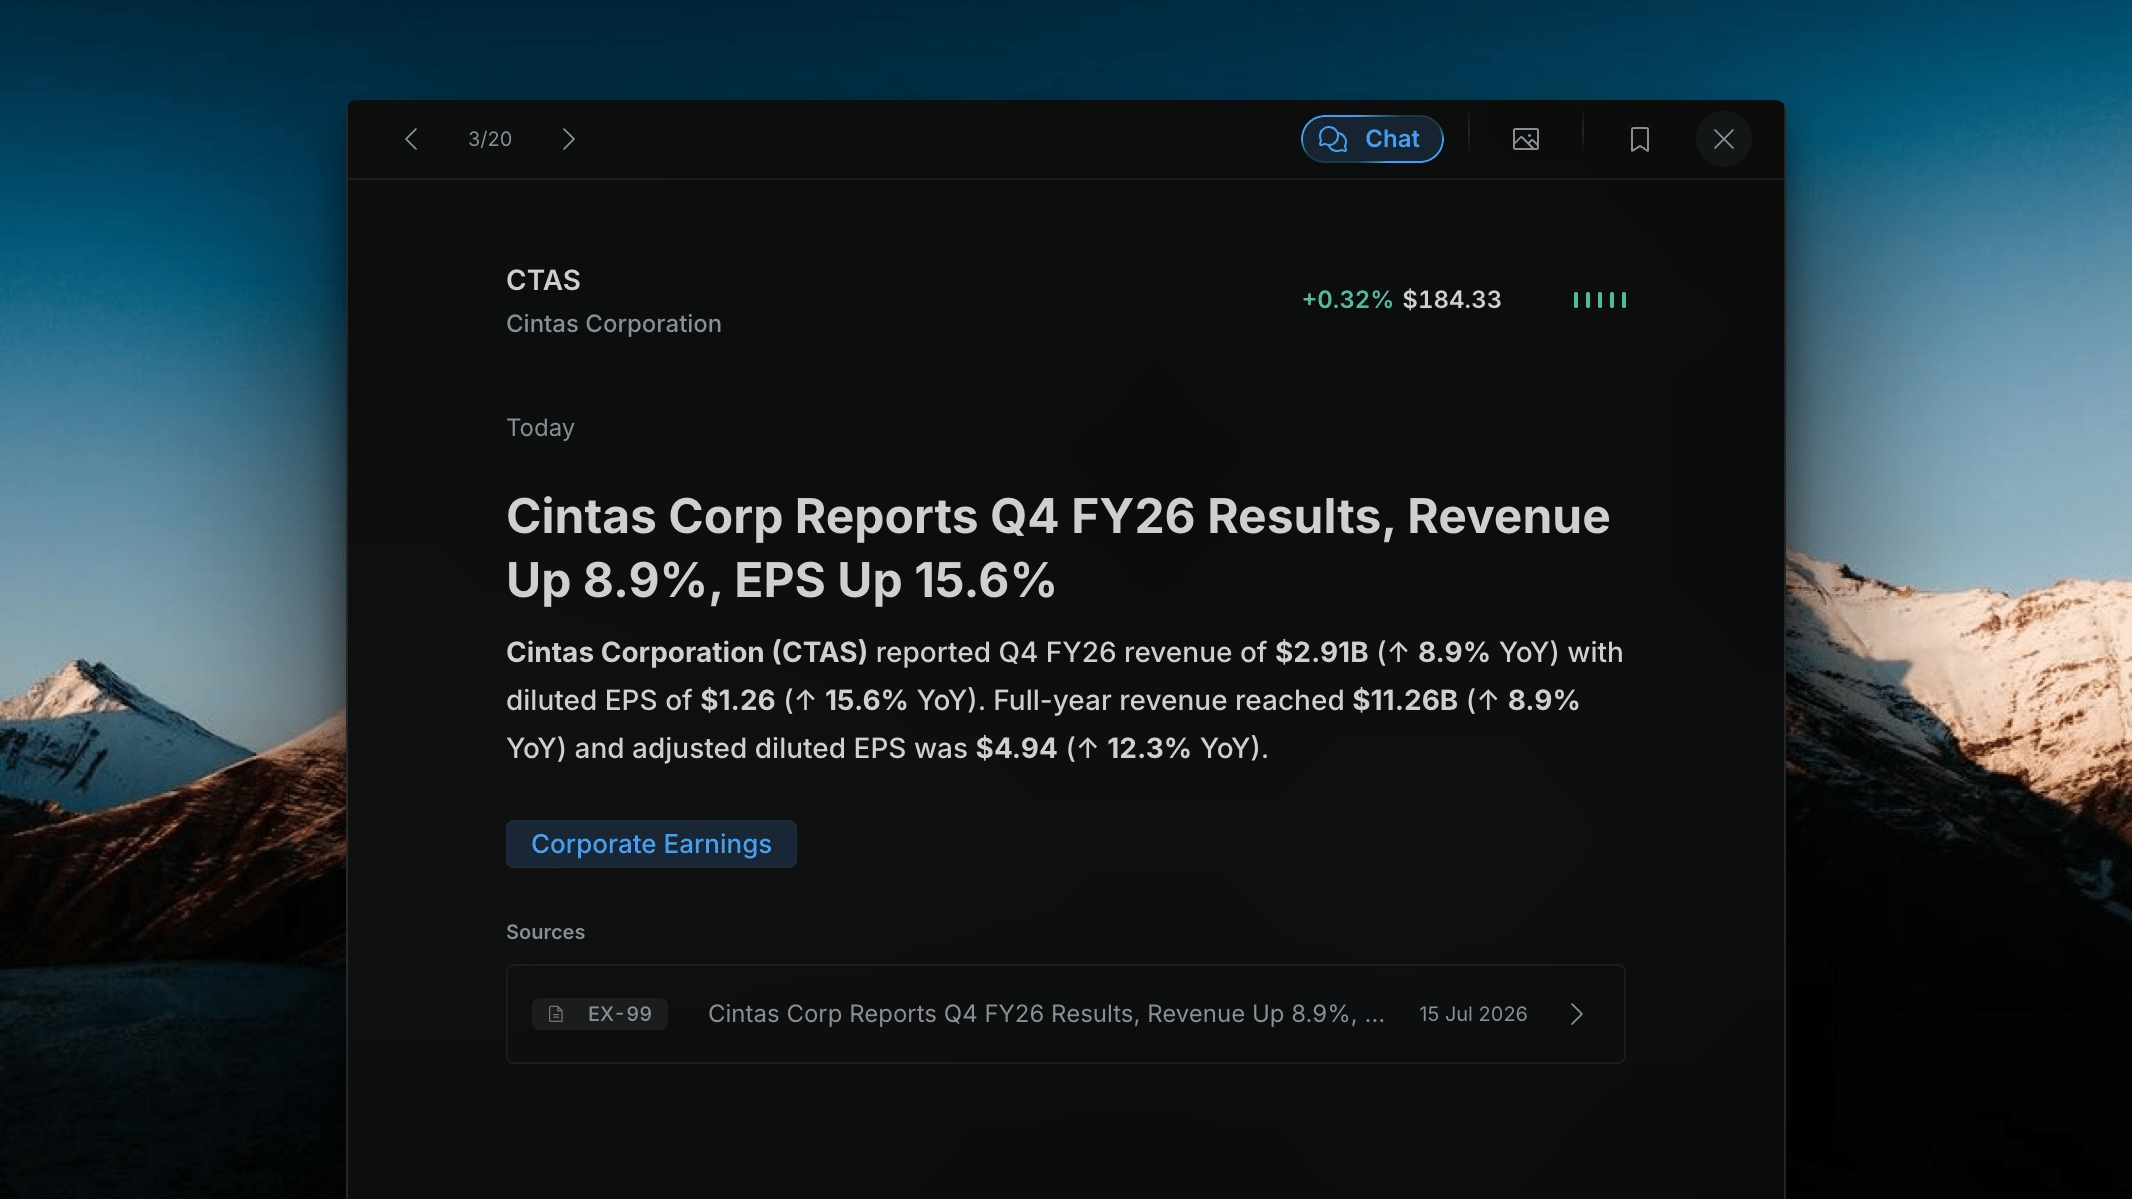
Header
Ticker symbol, company name, current price change, and the impact signal bars (color-coded: red / yellow / green).
Date & Title
Publication date (e.g. “Today”) above the full article headline in large bold text.
AI Summary
A concise AI-generated paragraph summarizing the key facts. Key financial figures (revenue, EPS, % changes) are bolded inline for quick scanning.
Category Badge
One or more category tags (e.g. Corporate Earnings, C-Level Change) identifying the event type.
Sources Section
Below the AI summary, the Sources section lists the original filings or press releases the article is based on. Each source row shows:- Filing type (e.g. EX-99, 8-K, press release)
- Title of the source document
- Date of the filing
- An arrow → to open the full document
Document Viewer
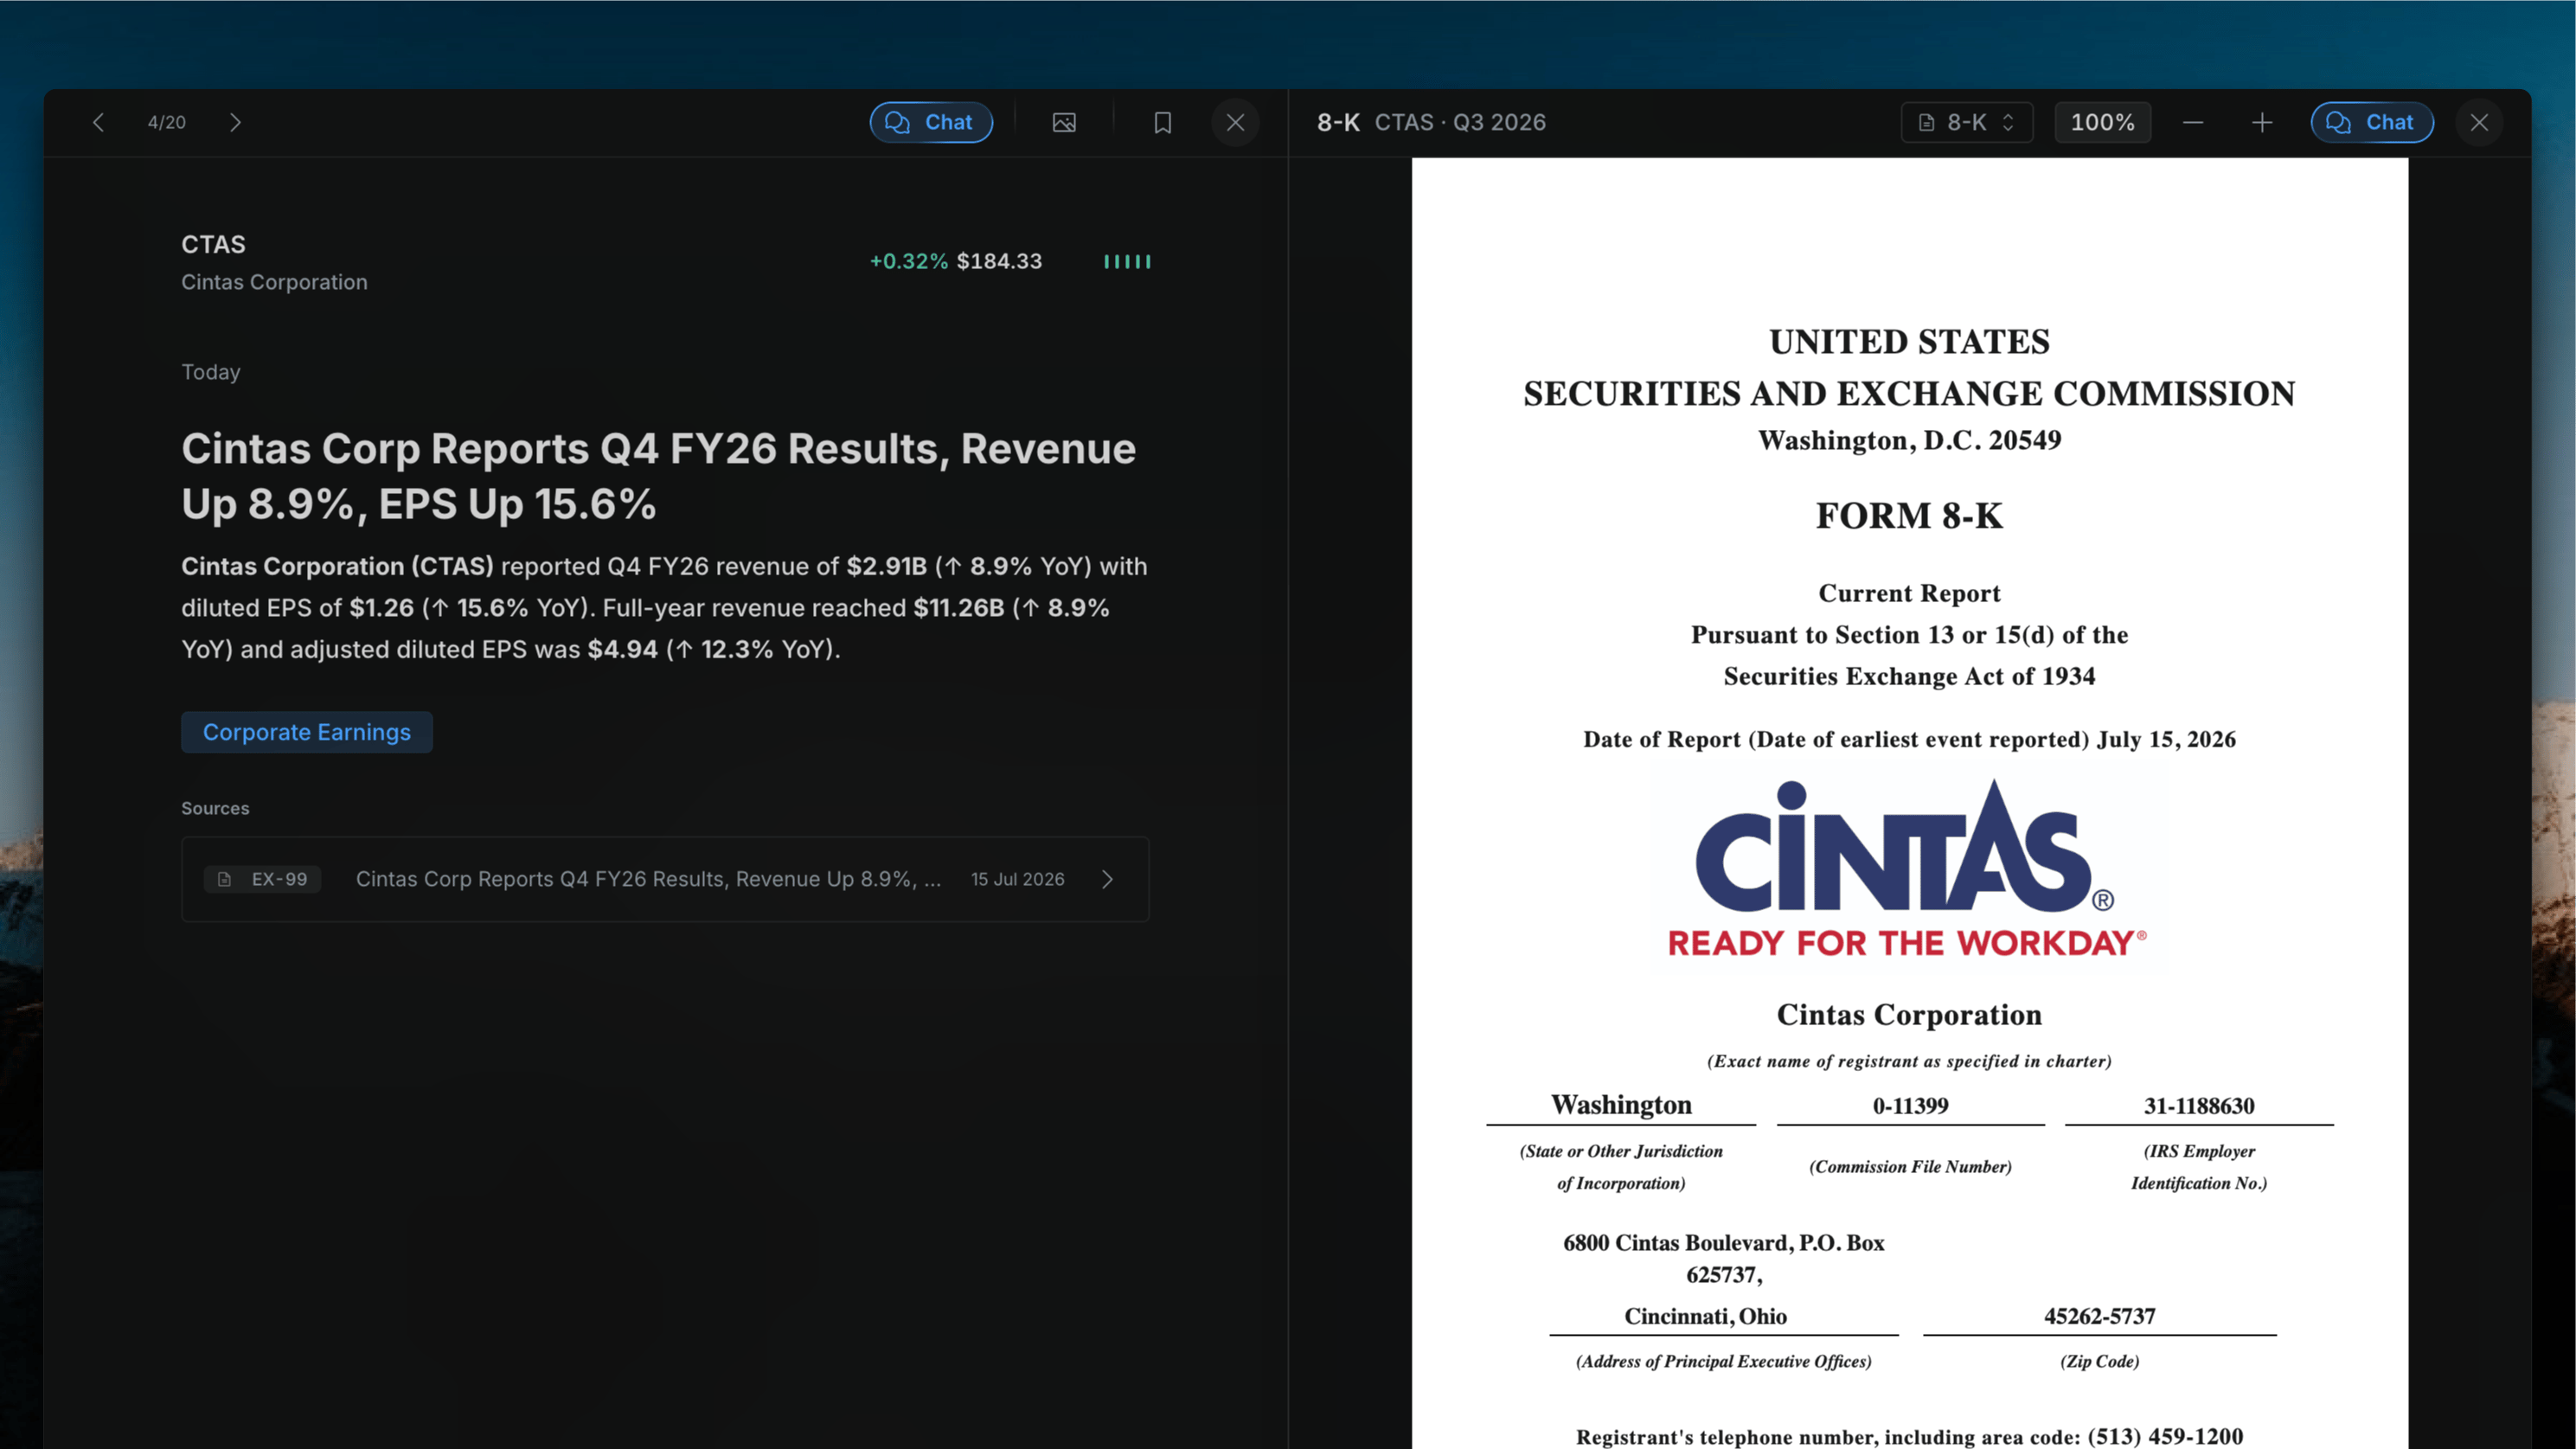
Clicking a source row opens the original filing in a document viewer that appears as a panel on the right side of the screen, splitting the view. The article detail stays visible on the left.