
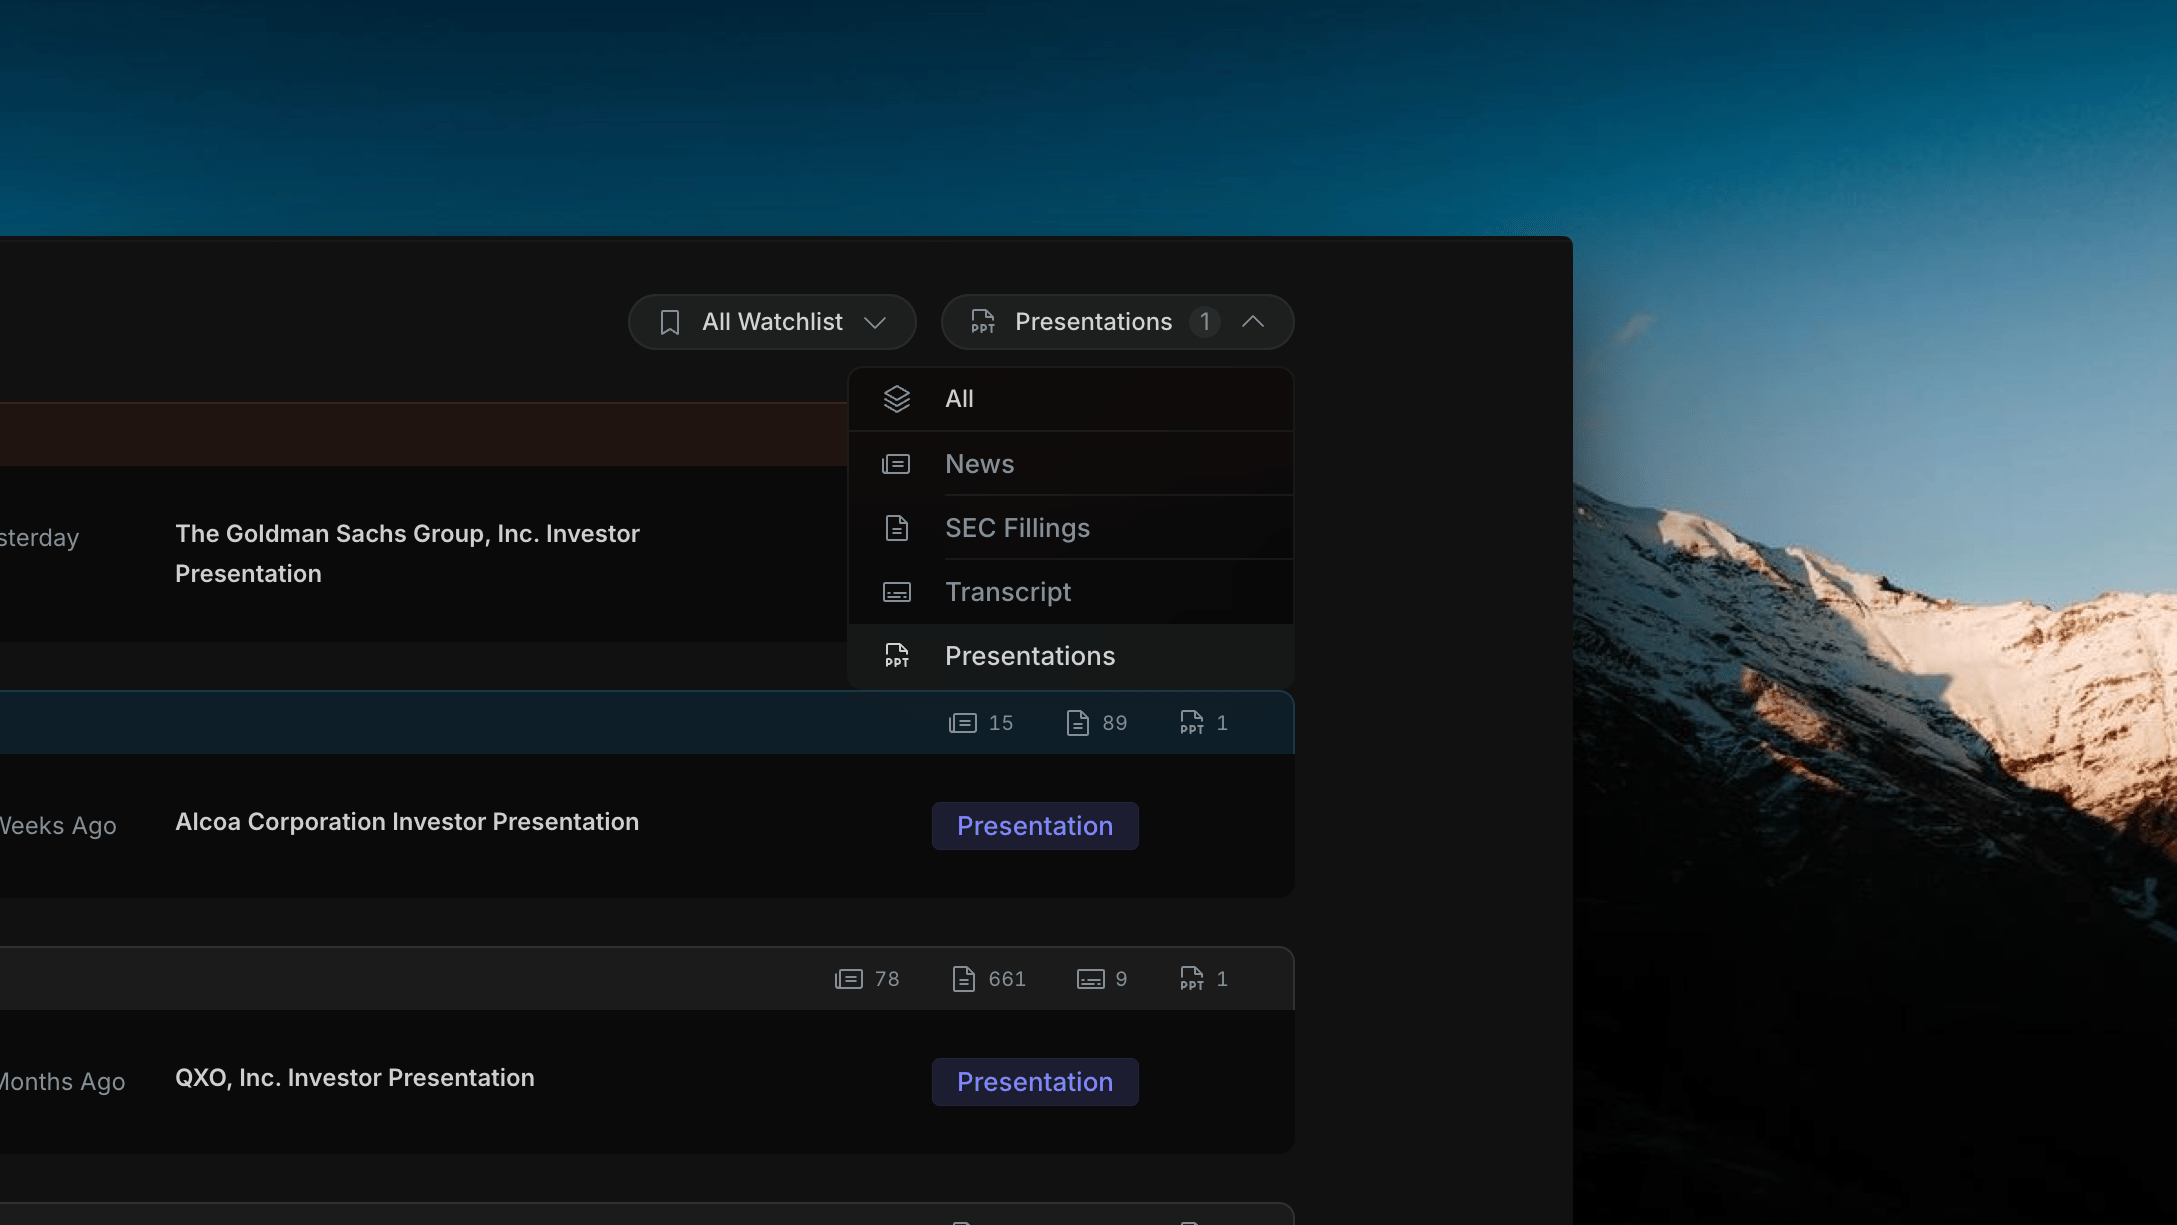
Insighthread's Presentations filter selected — right feed shows investor presentation rows with Presentation badge; left panel and sector list remain unchanged
What Changes When Presentations Is Selected
Right feed
Shows only investor presentation rows. Each row displays the ticker, date, and full presentation title (e.g. “The Goldman Sachs Group, Inc. Investor Presentation”) with a Presentation badge.
Left panel
No change. The sector performance list and index chart remain — market context stays in view while you browse presentations.
Opening a Presentation
Click any row in the right feed to open the presentation in the Slides viewer. The viewer renders each slide as a full-width image, stacked vertically so you can scroll through the deck from cover to last page. The header shows the company ticker and name. Slides are displayed in order — title slide first, followed by results snapshots, financial overviews, and any other sections the company included in their filing.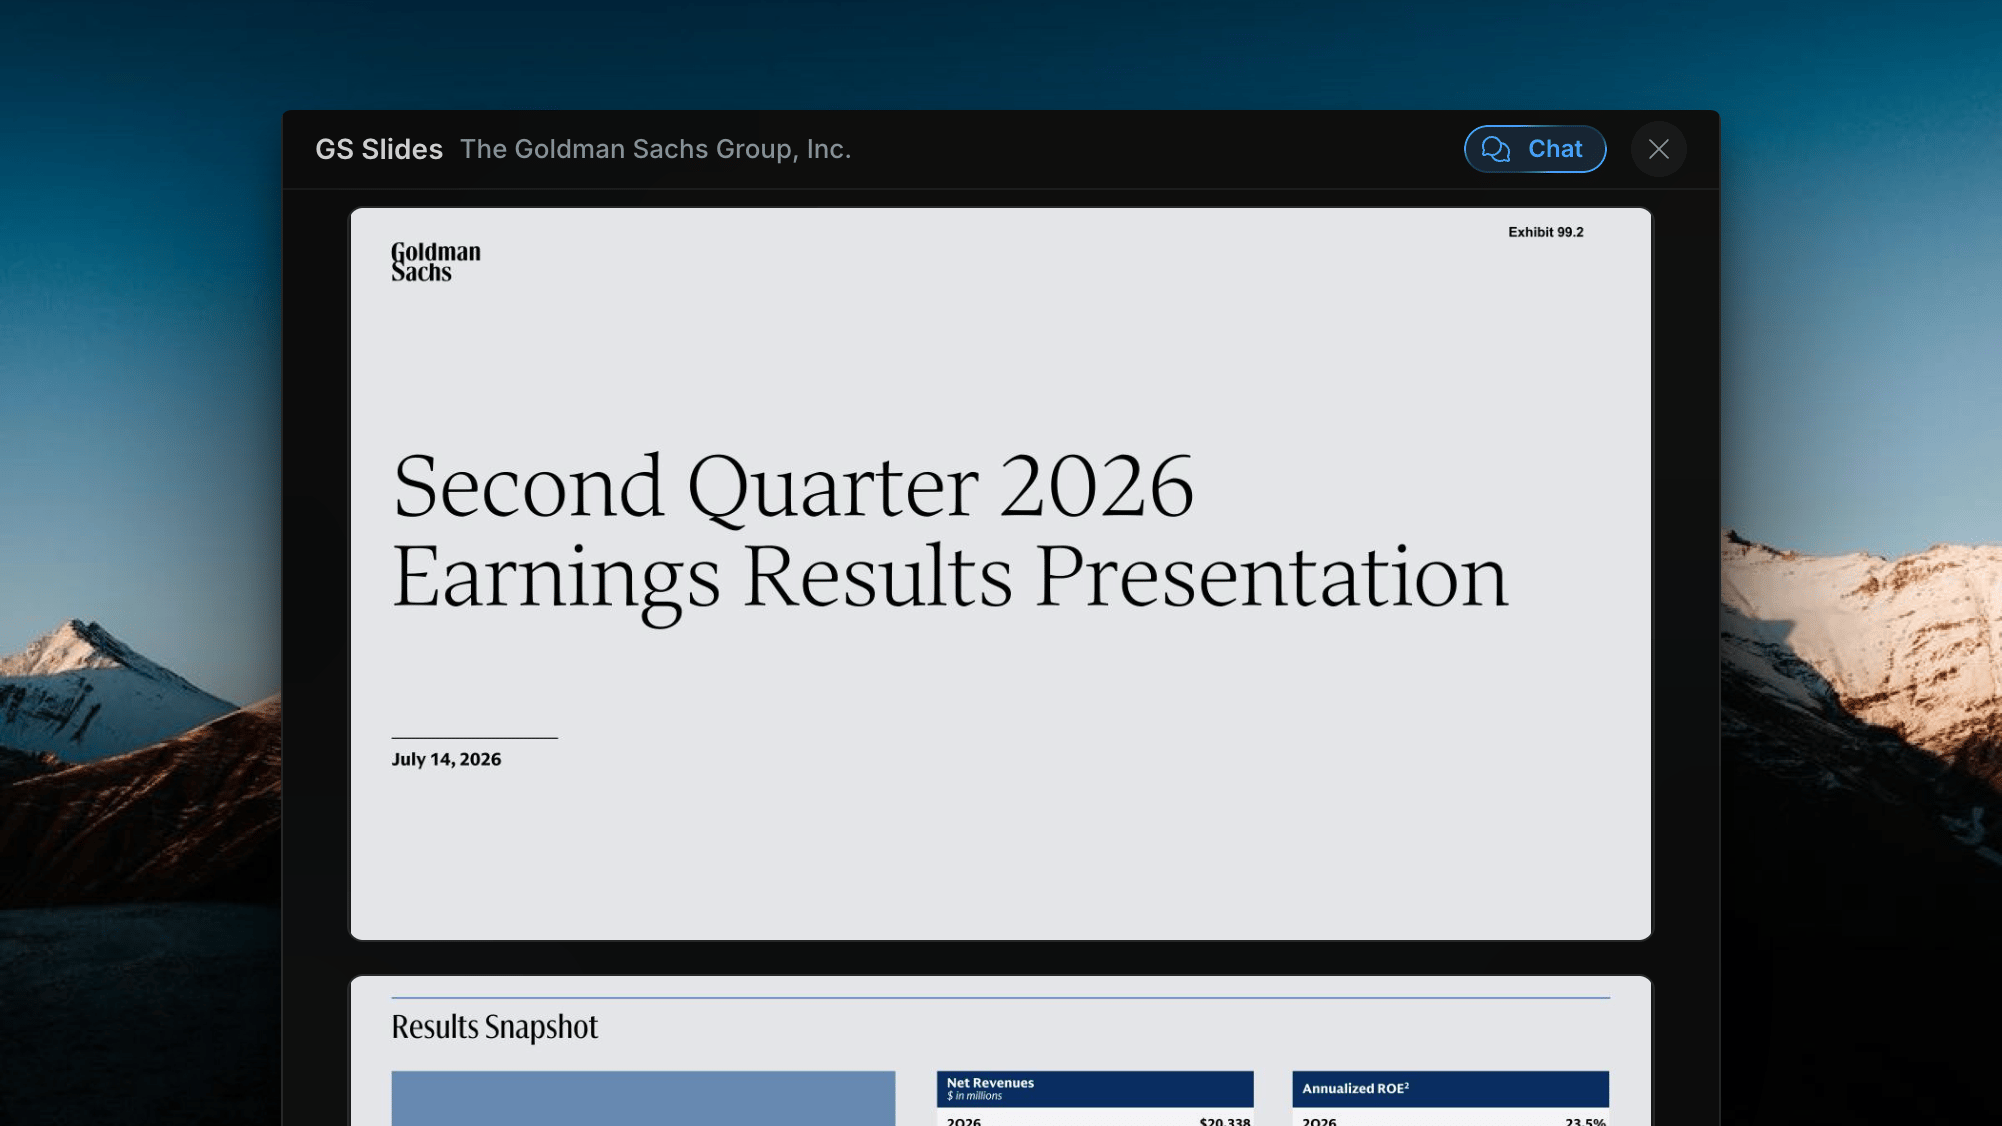
Insighthread's Slides viewer — full presentation rendered slide by slide; Ask AI button in the header opens an AI session scoped to this deck