
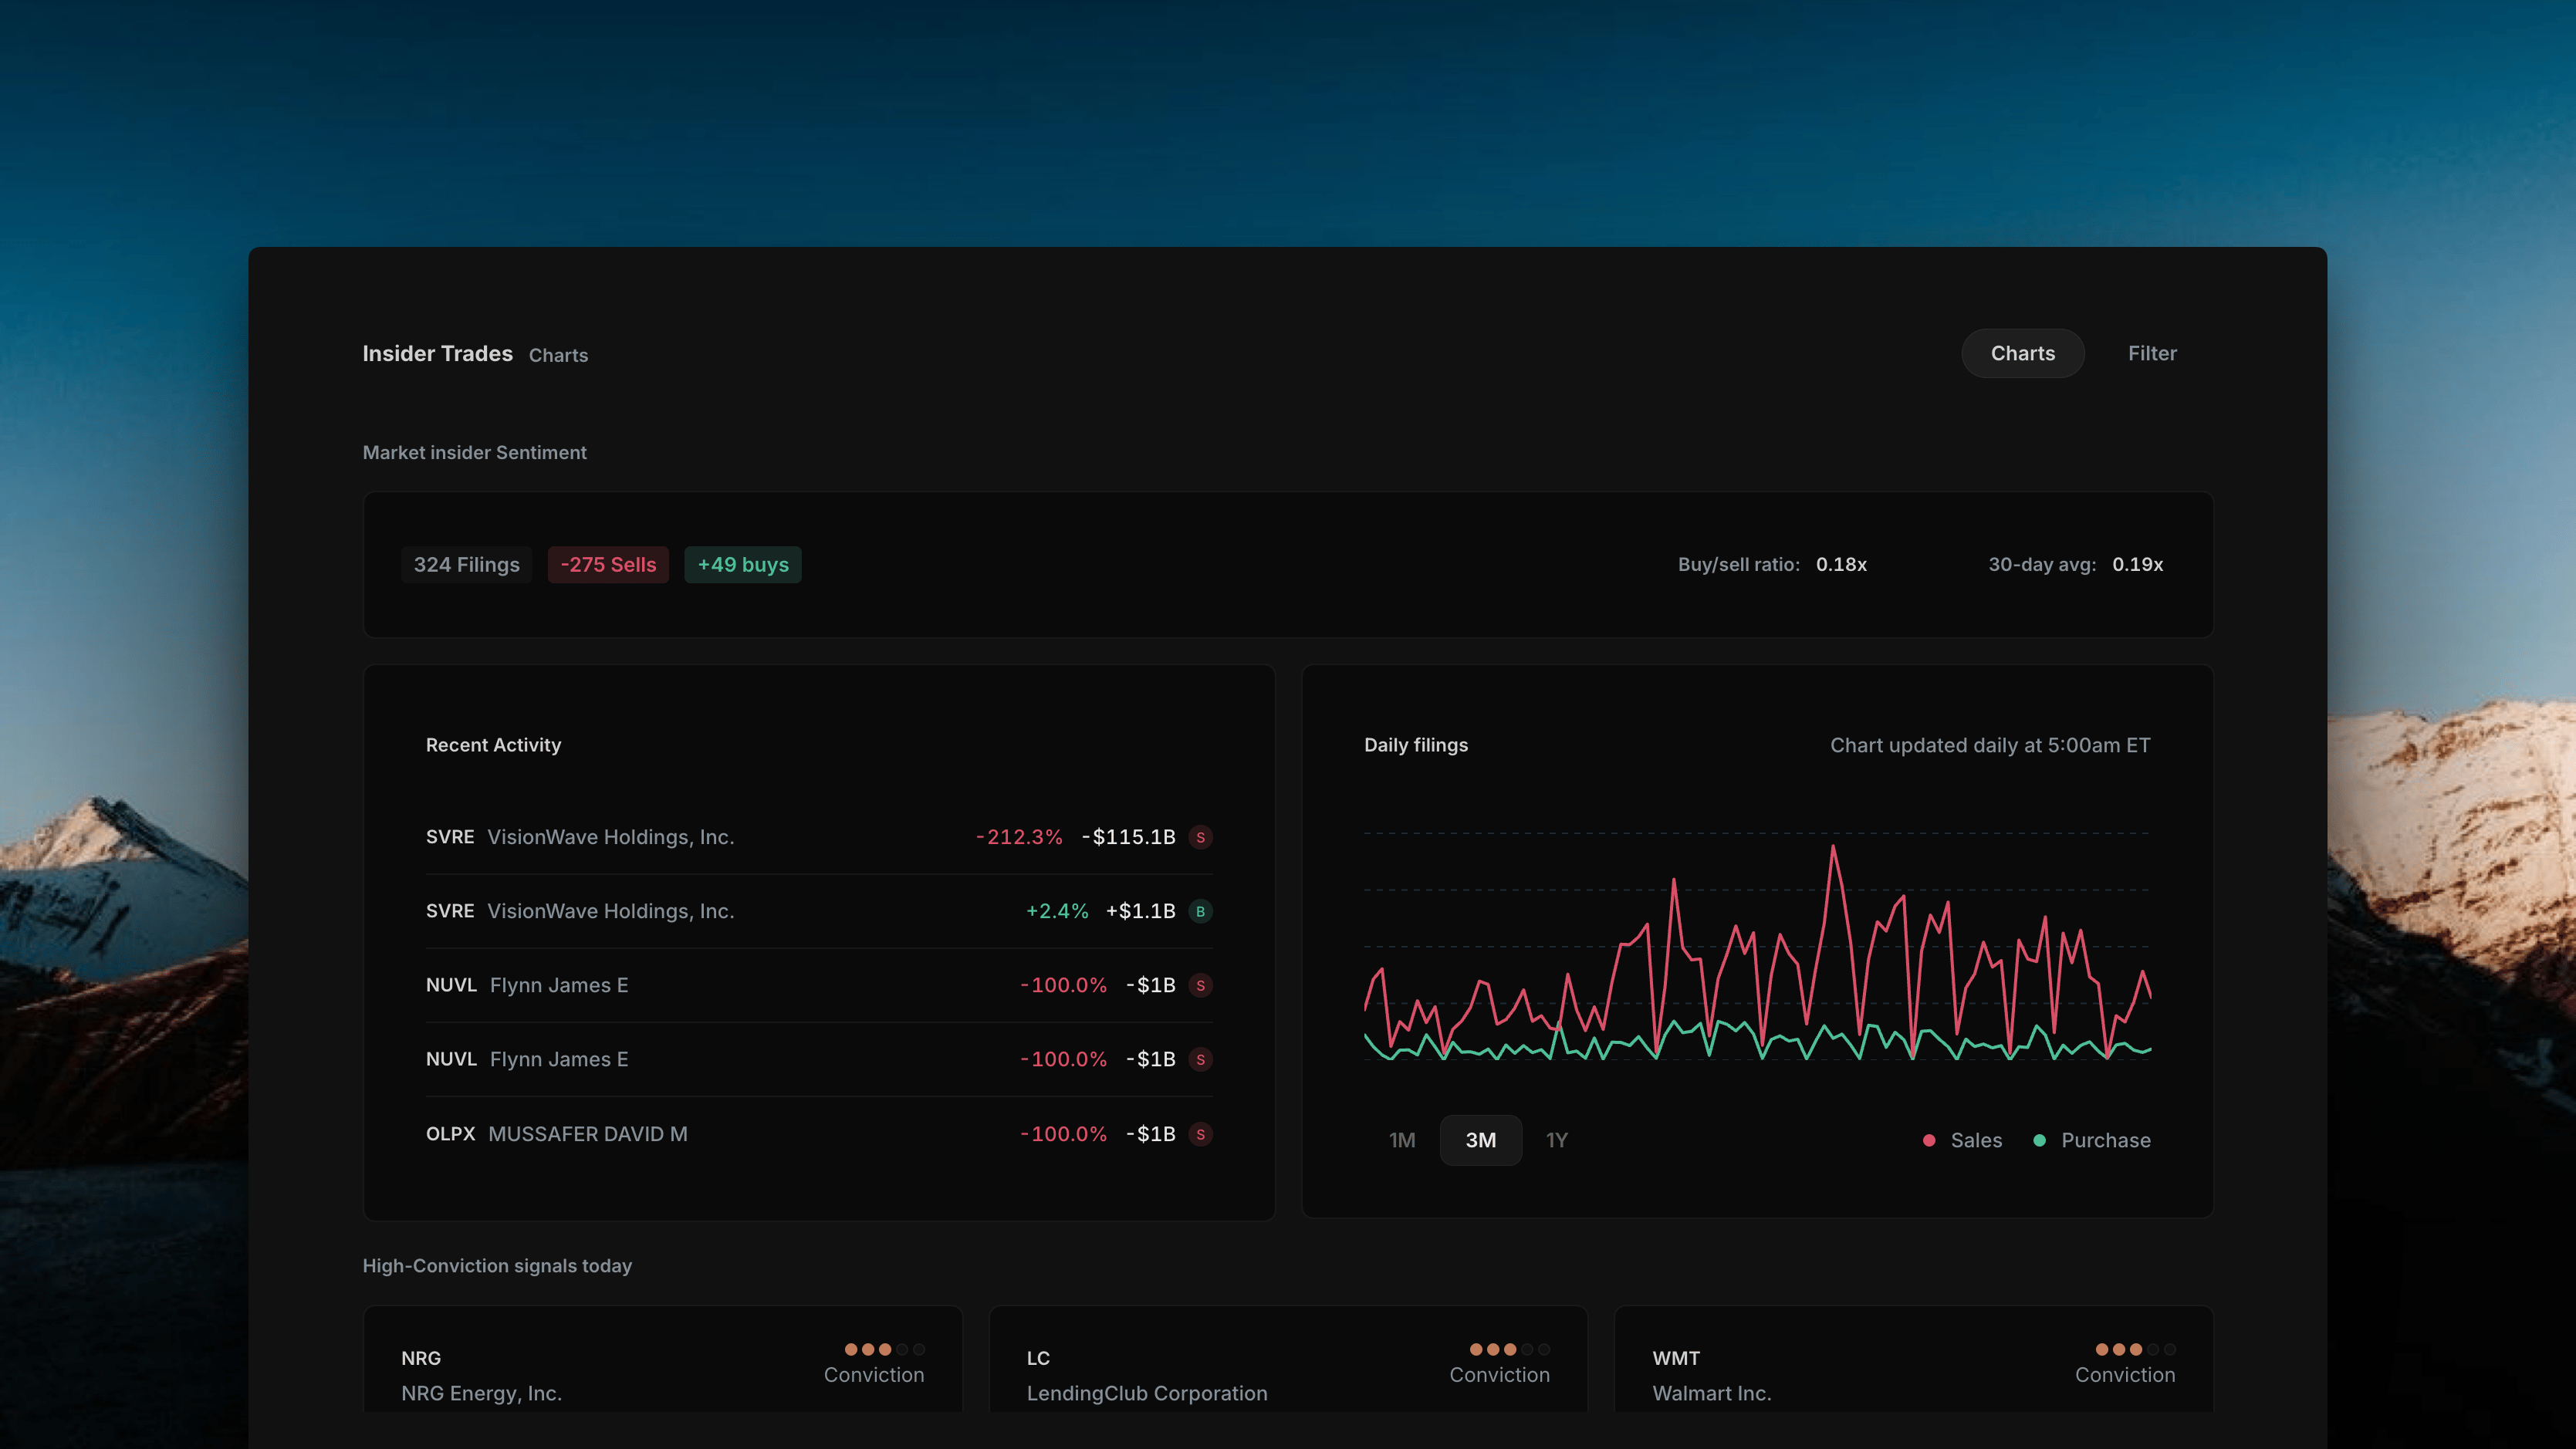
Insighthread's Insider Trades page in Charts view — Market Insider Sentiment bar, Recent Activity, Daily Filings chart, and High-Conviction Signals
Market Insider Sentiment
At the top of the Charts view, a single summary bar gives you the market-wide snapshot for the current period: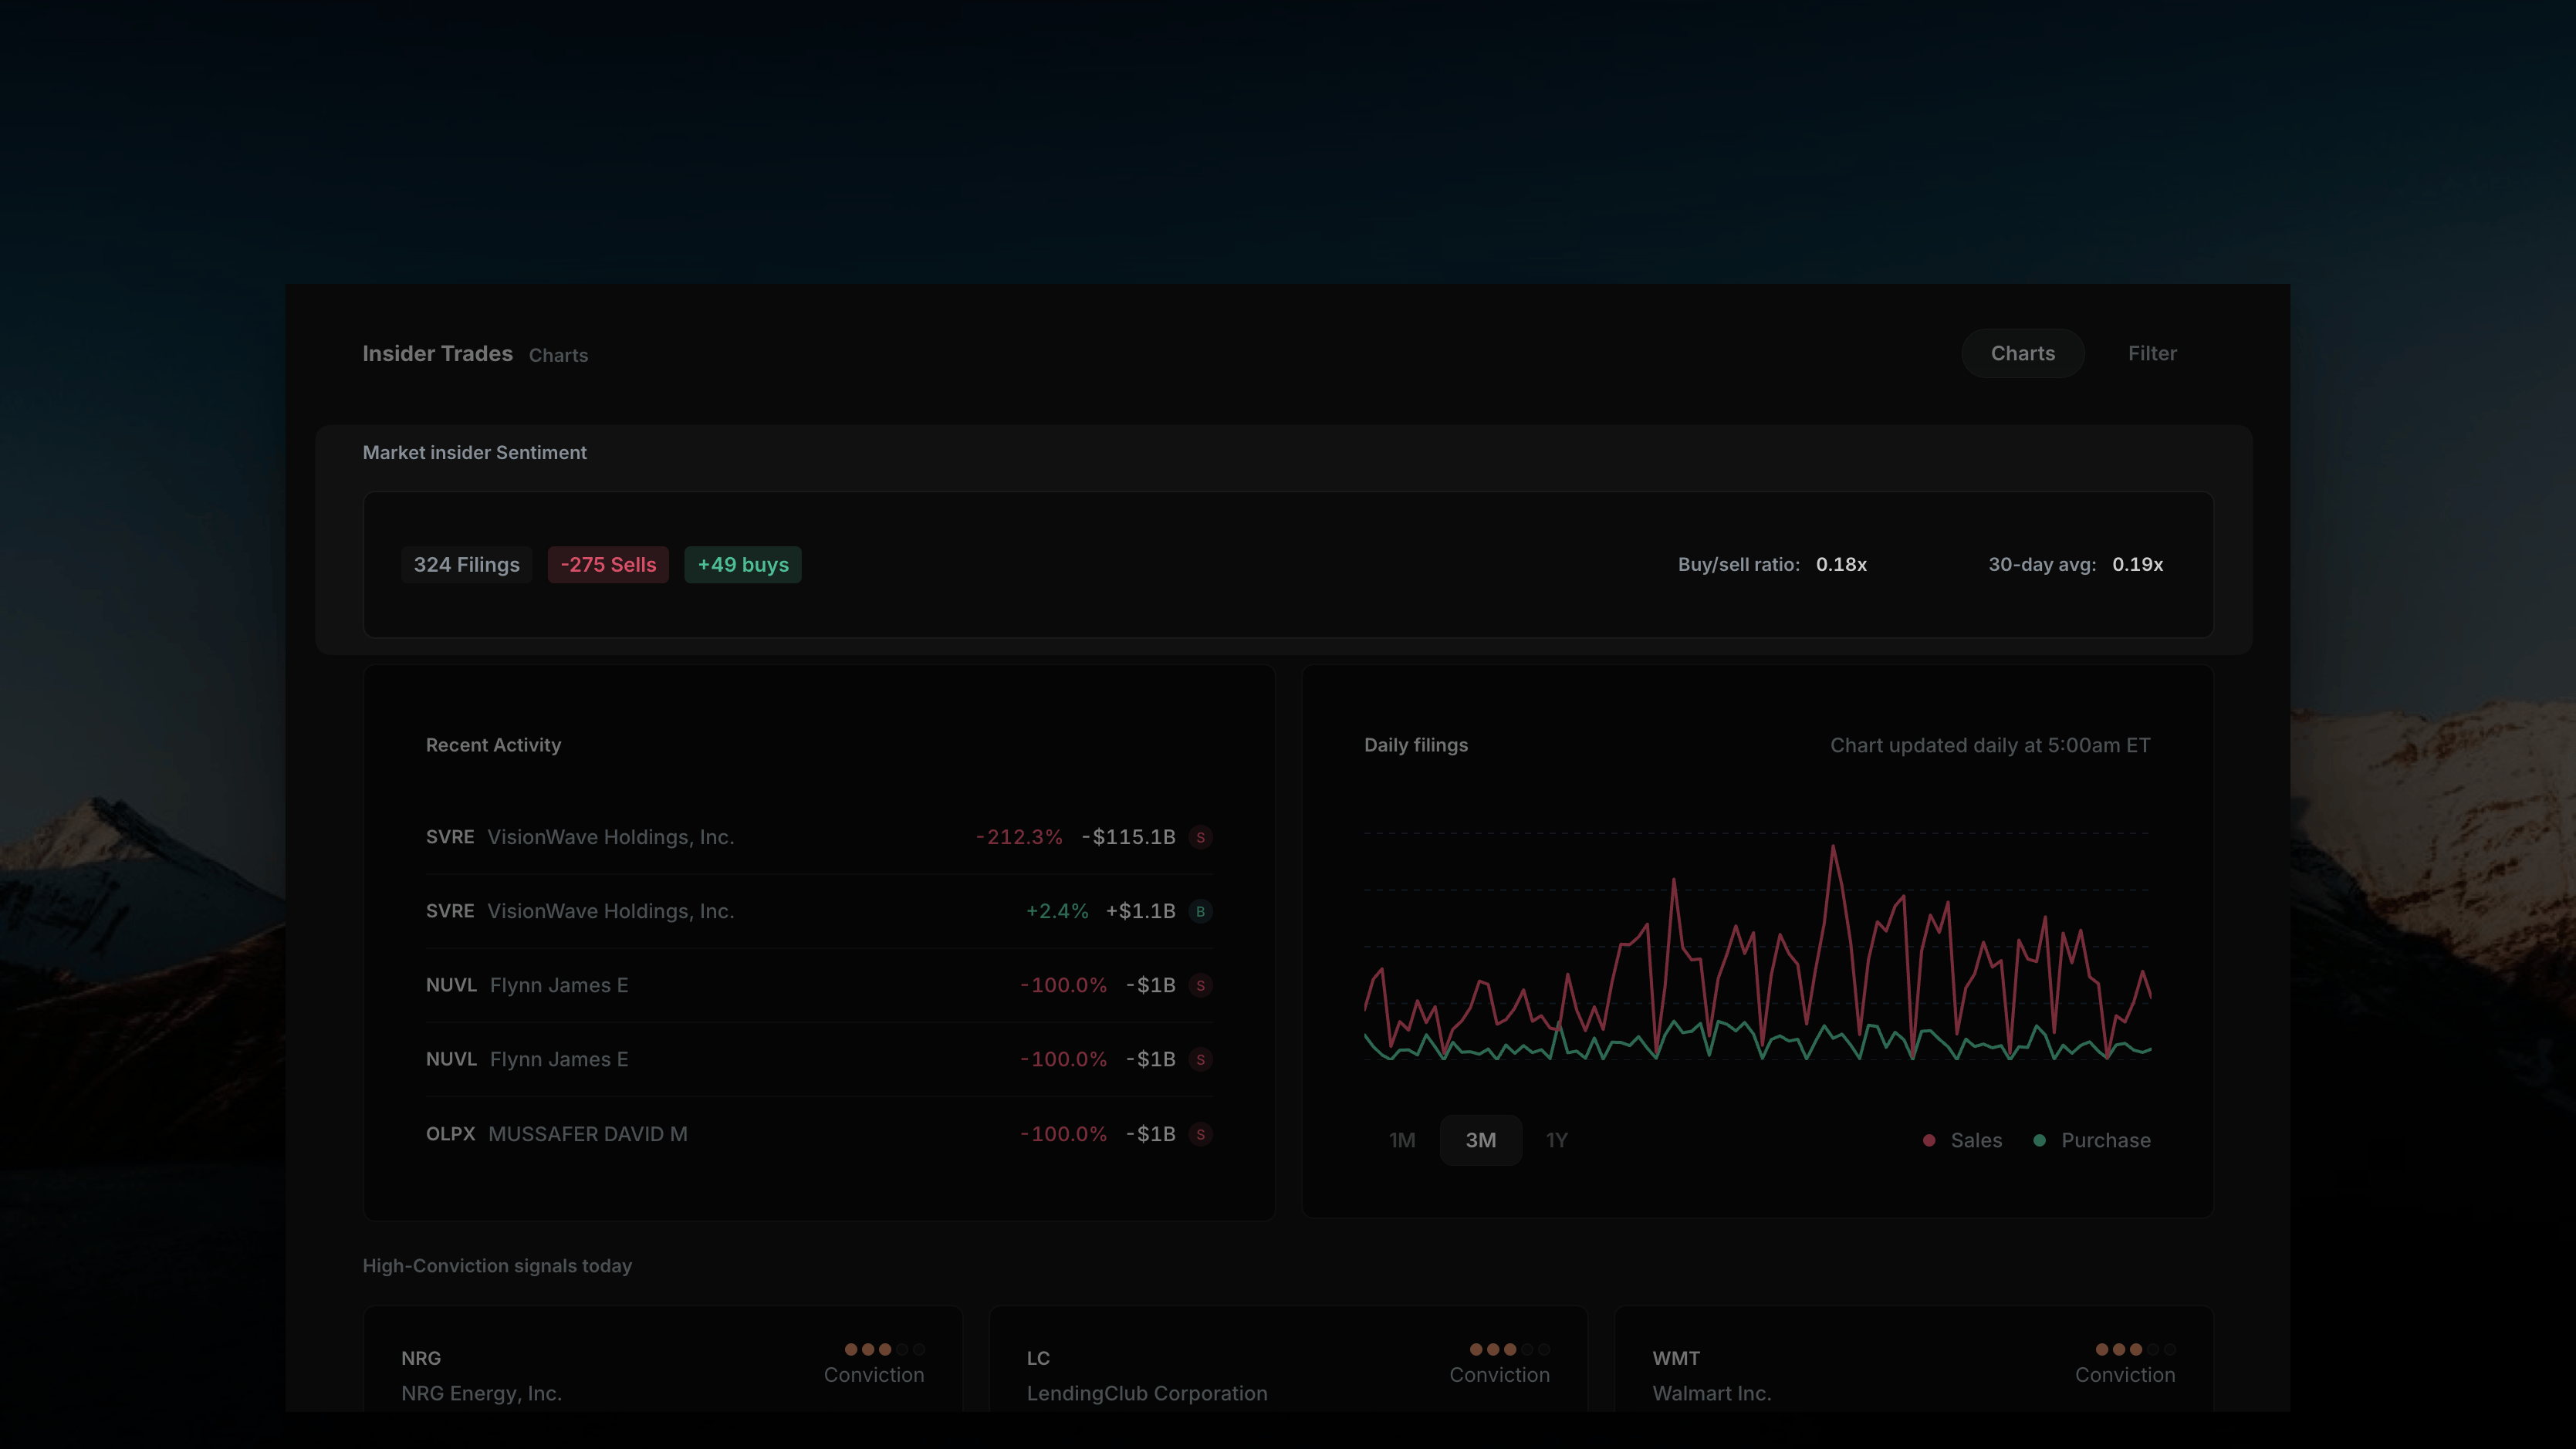
The Market Insider Sentiment bar — filings count, sells, buys, buy/sell ratio, and 30-day average
Recent Activity & Daily Filings
Below the sentiment bar, two panels sit side by side.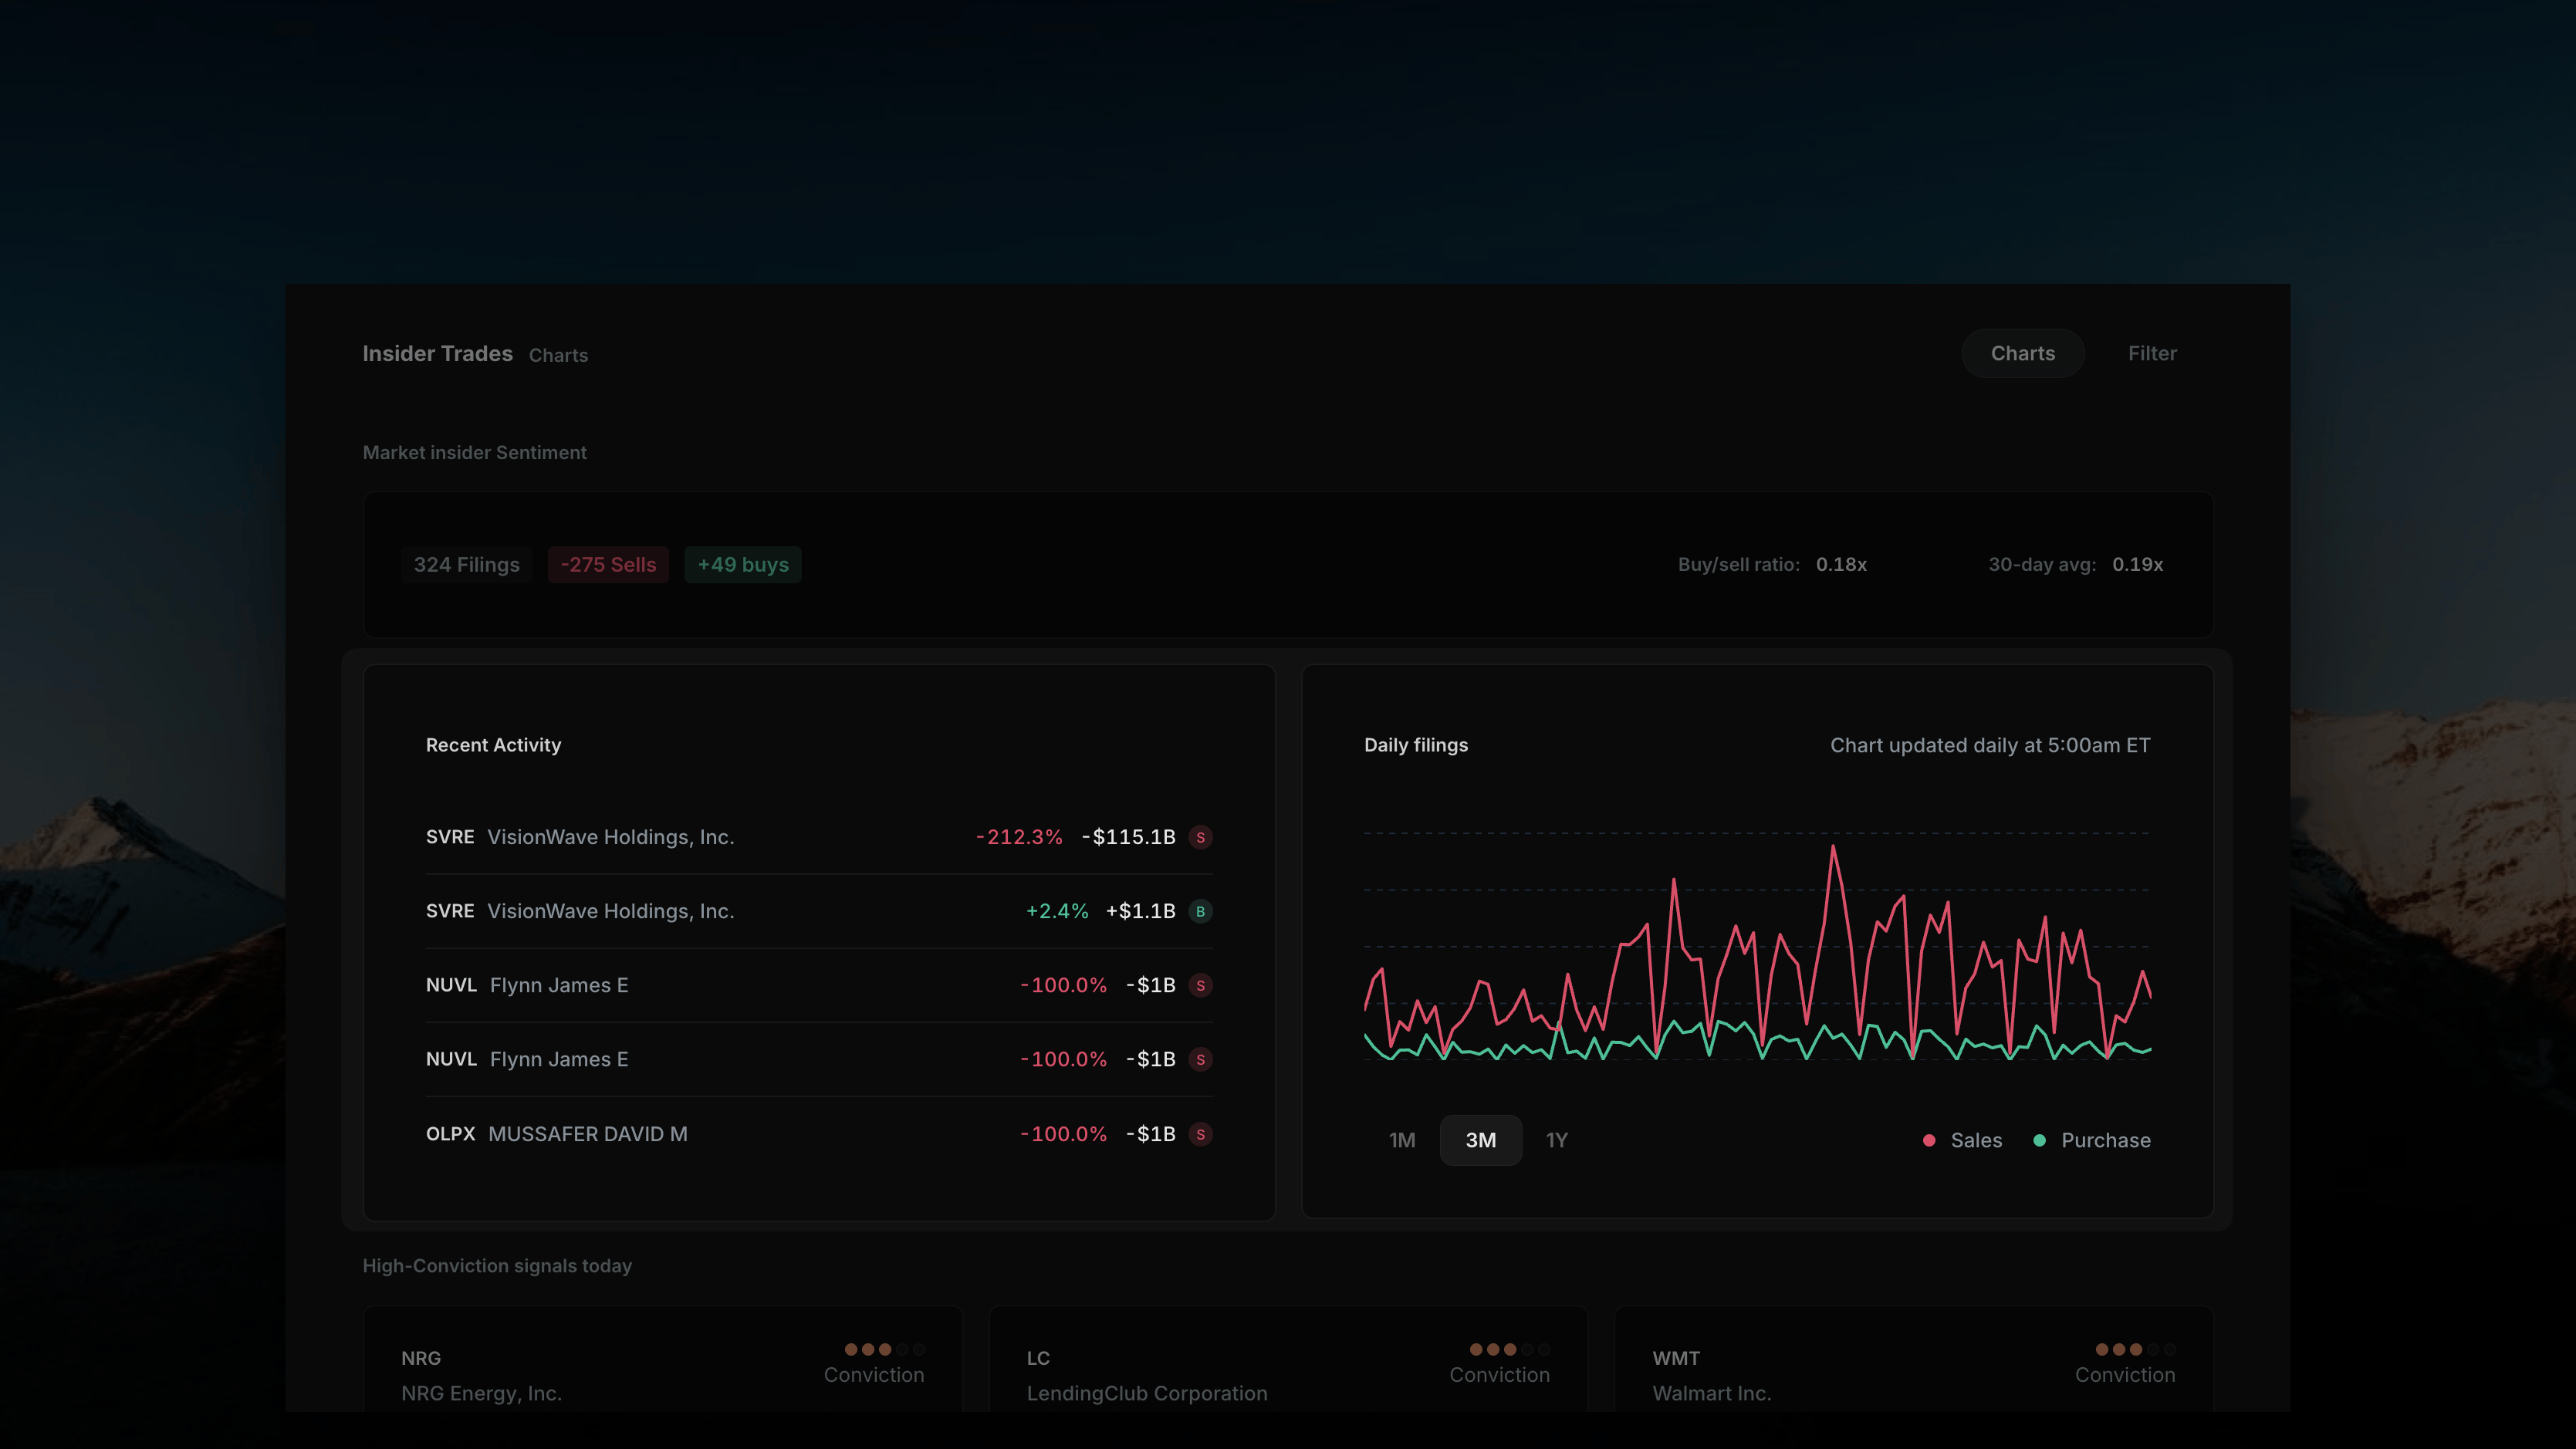
Recent Activity (left) and Daily Filings chart (right) — Sales vs. Purchase lines with 1M/3M/1Y toggle
Recent Activity (Left)
Daily Filings (Right)
High-Conviction Signals Today
This section surfaces the day’s most significant transactions as individual cards, one per ticker. Each card shows: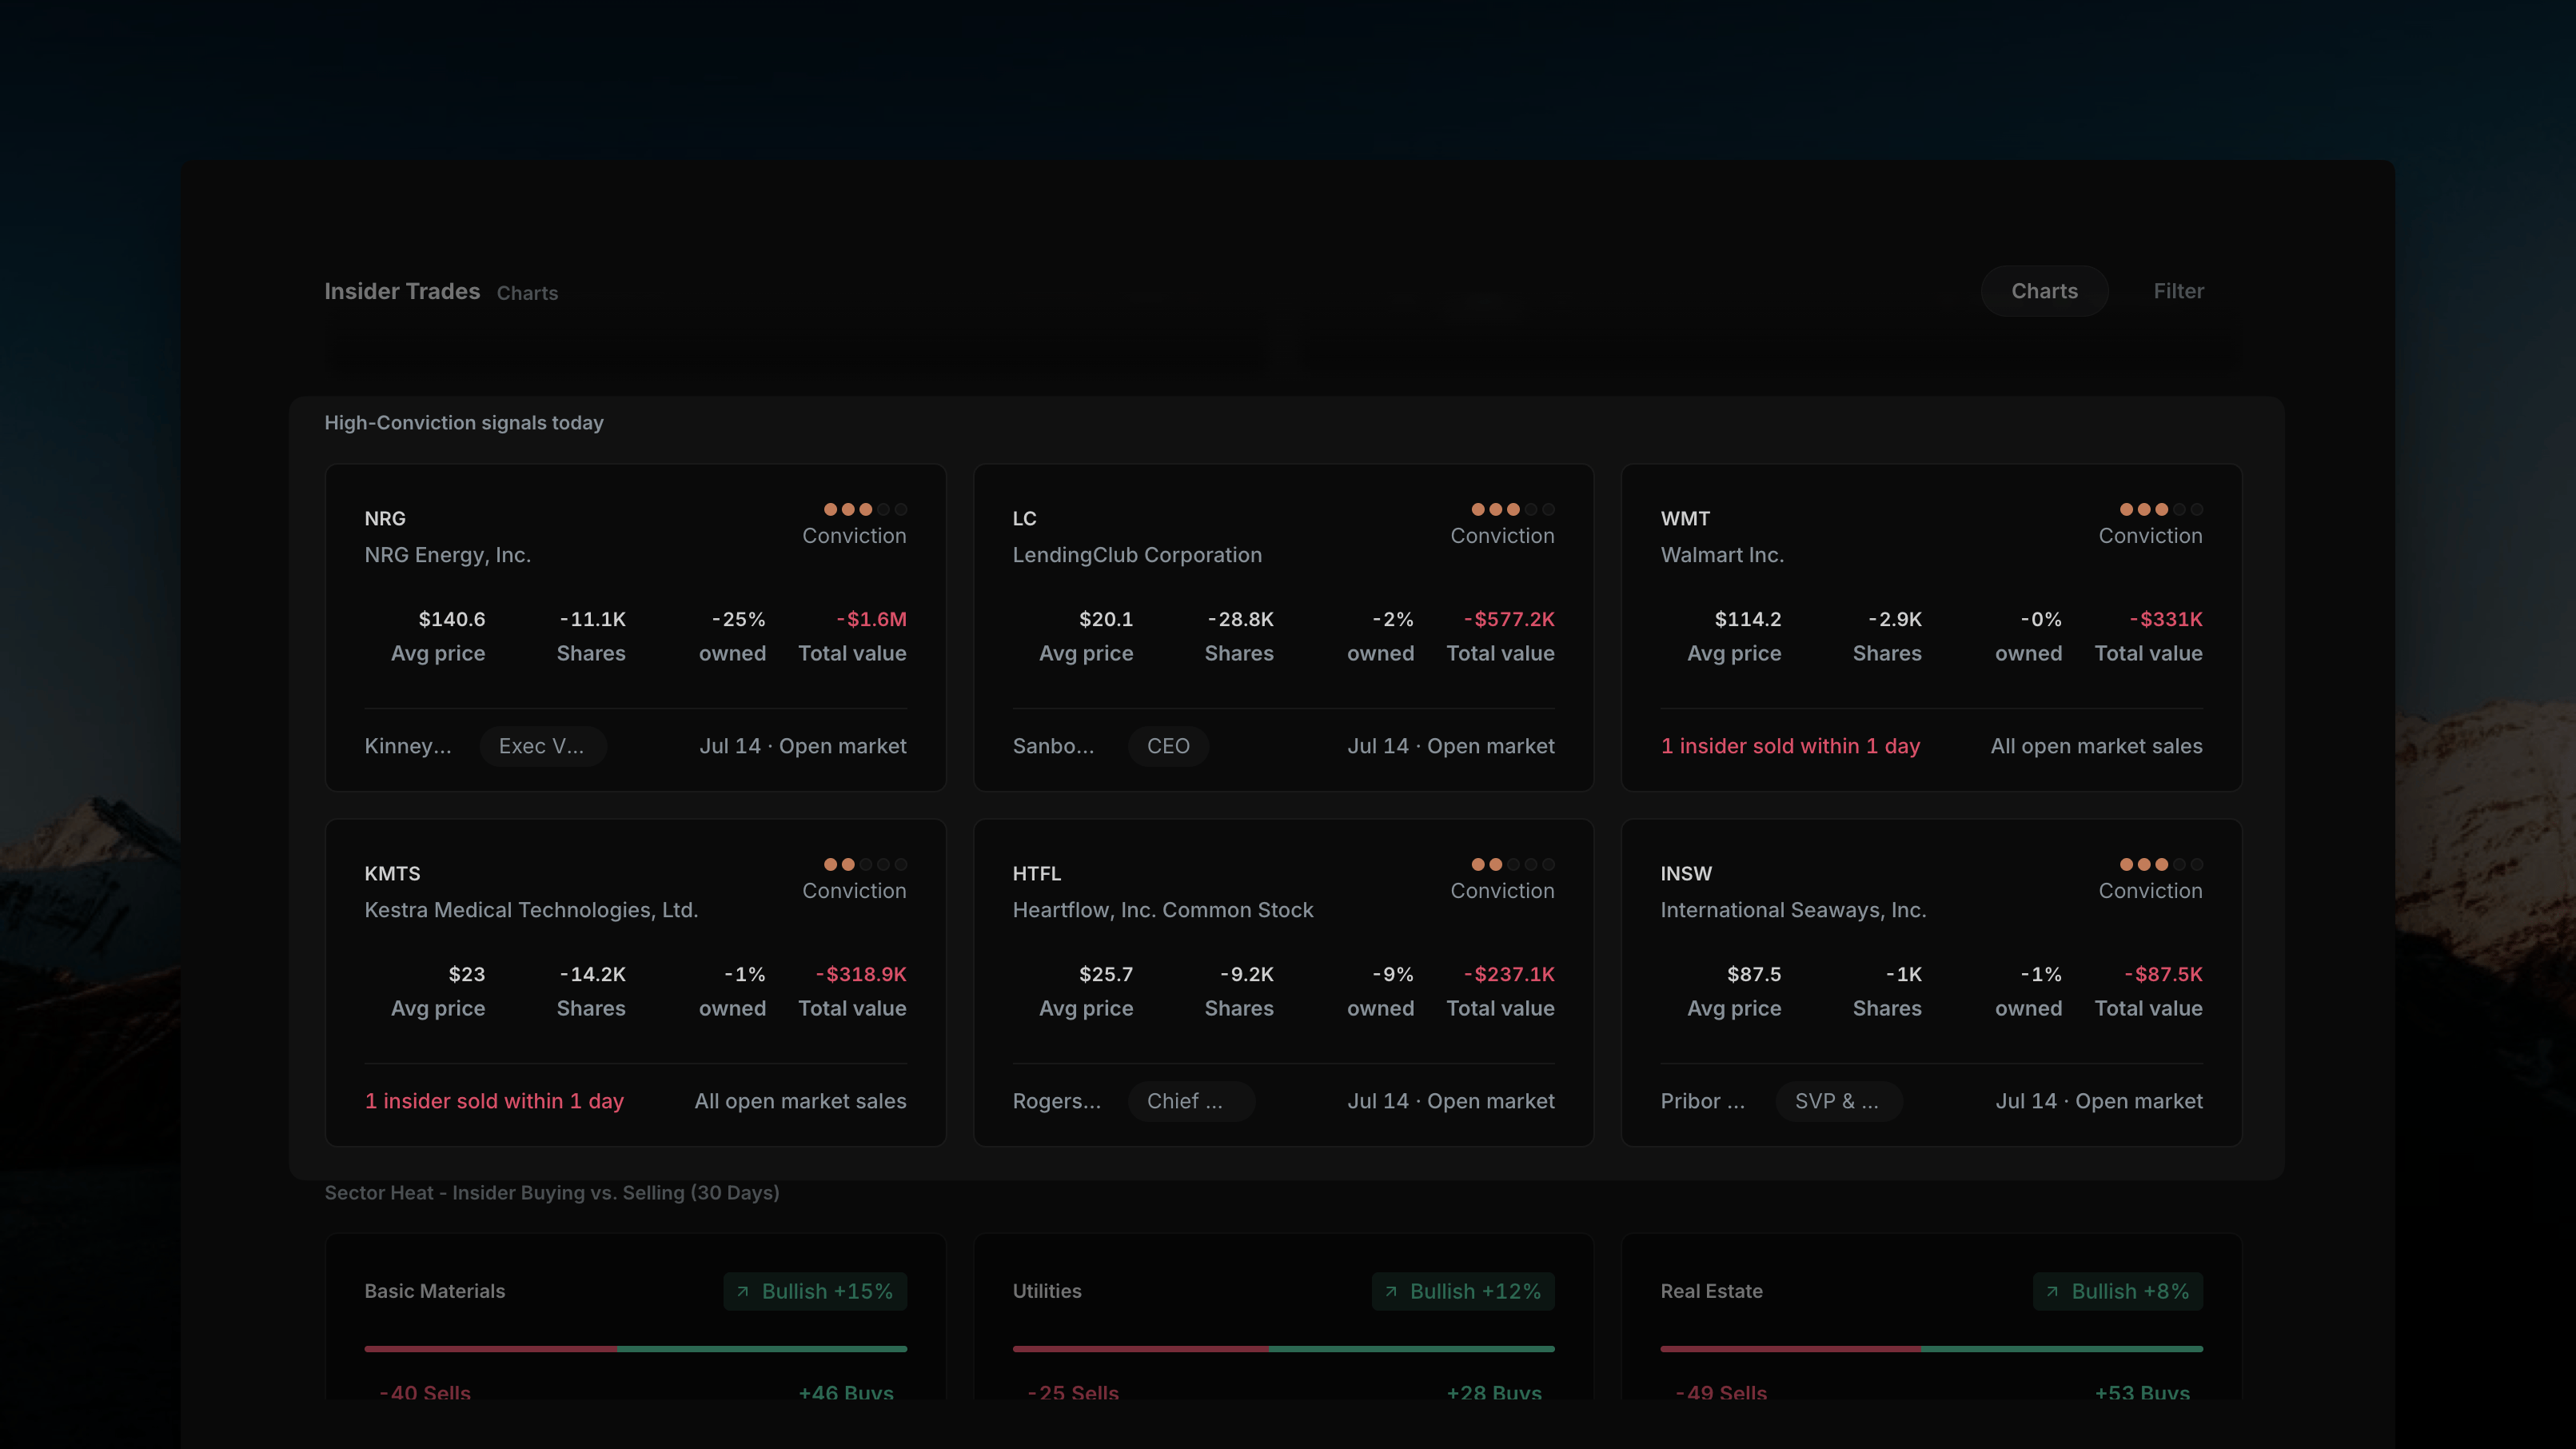
High-Conviction Signals cards for NRG, LC, and WMT — Conviction dots, avg price, shares, % owned, and total value
- Conviction dots — a proprietary score (see Conviction Scoring) shown as a filled-dot meter in the top-right of the card
- Avg price, Shares change, % owned change, and Total value of the transaction
- The insider’s name and title (e.g. Director, CEO, EVP)
- The filing date and trade type (e.g. “Jul 14 · Open market”)
- A contextual note where relevant, e.g. “1 insider sold within 1 day” or “All open market sales”
Sector Heat — Insider Buying vs. Selling (30 Days)
A grid of sector tiles shows net insider direction by sector over a trailing 30-day window. Each tile has: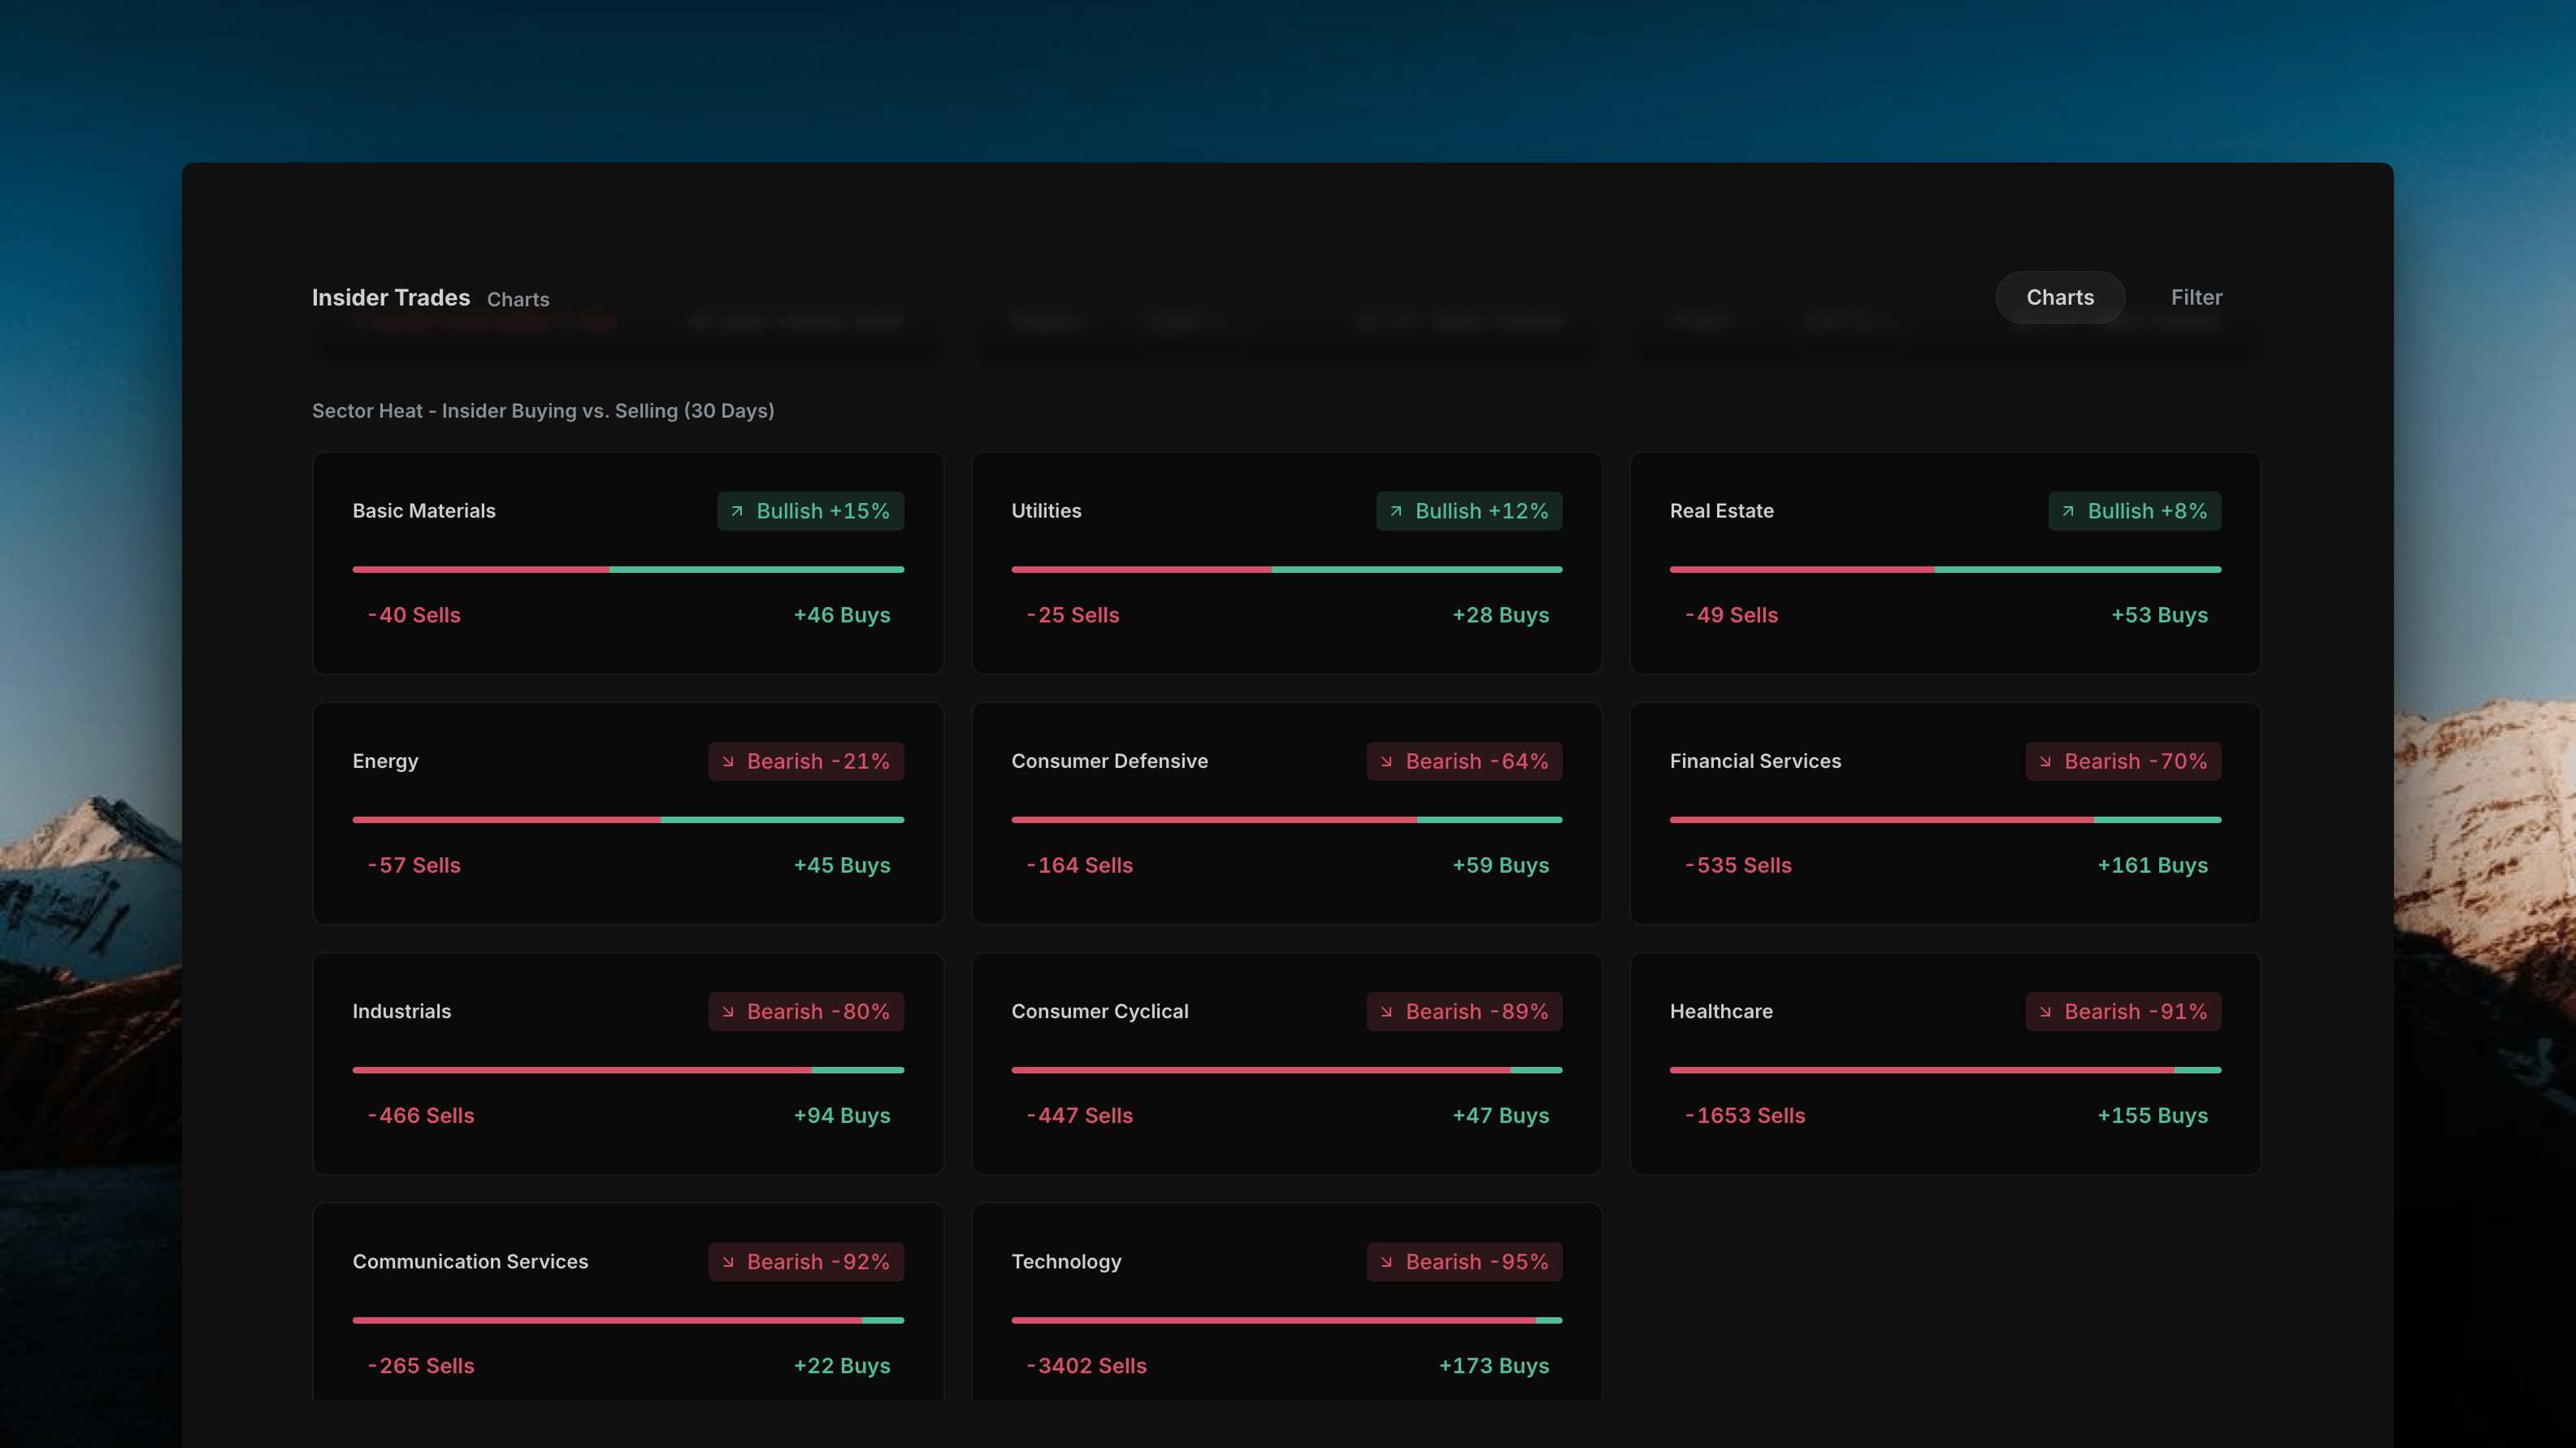
Sector Heat grid — bullish sectors like Basic Materials, Utilities, and Real Estate with net buy/sell counts
- The sector name
- A Bullish/Bearish badge with a net percentage (e.g. “Bullish +15%”, “Bearish -95%”)
- A horizontal Sells/Buys bar, with the split visualized in red (sells) and green (buys)
- Raw counts: -X Sells and +Y Buys
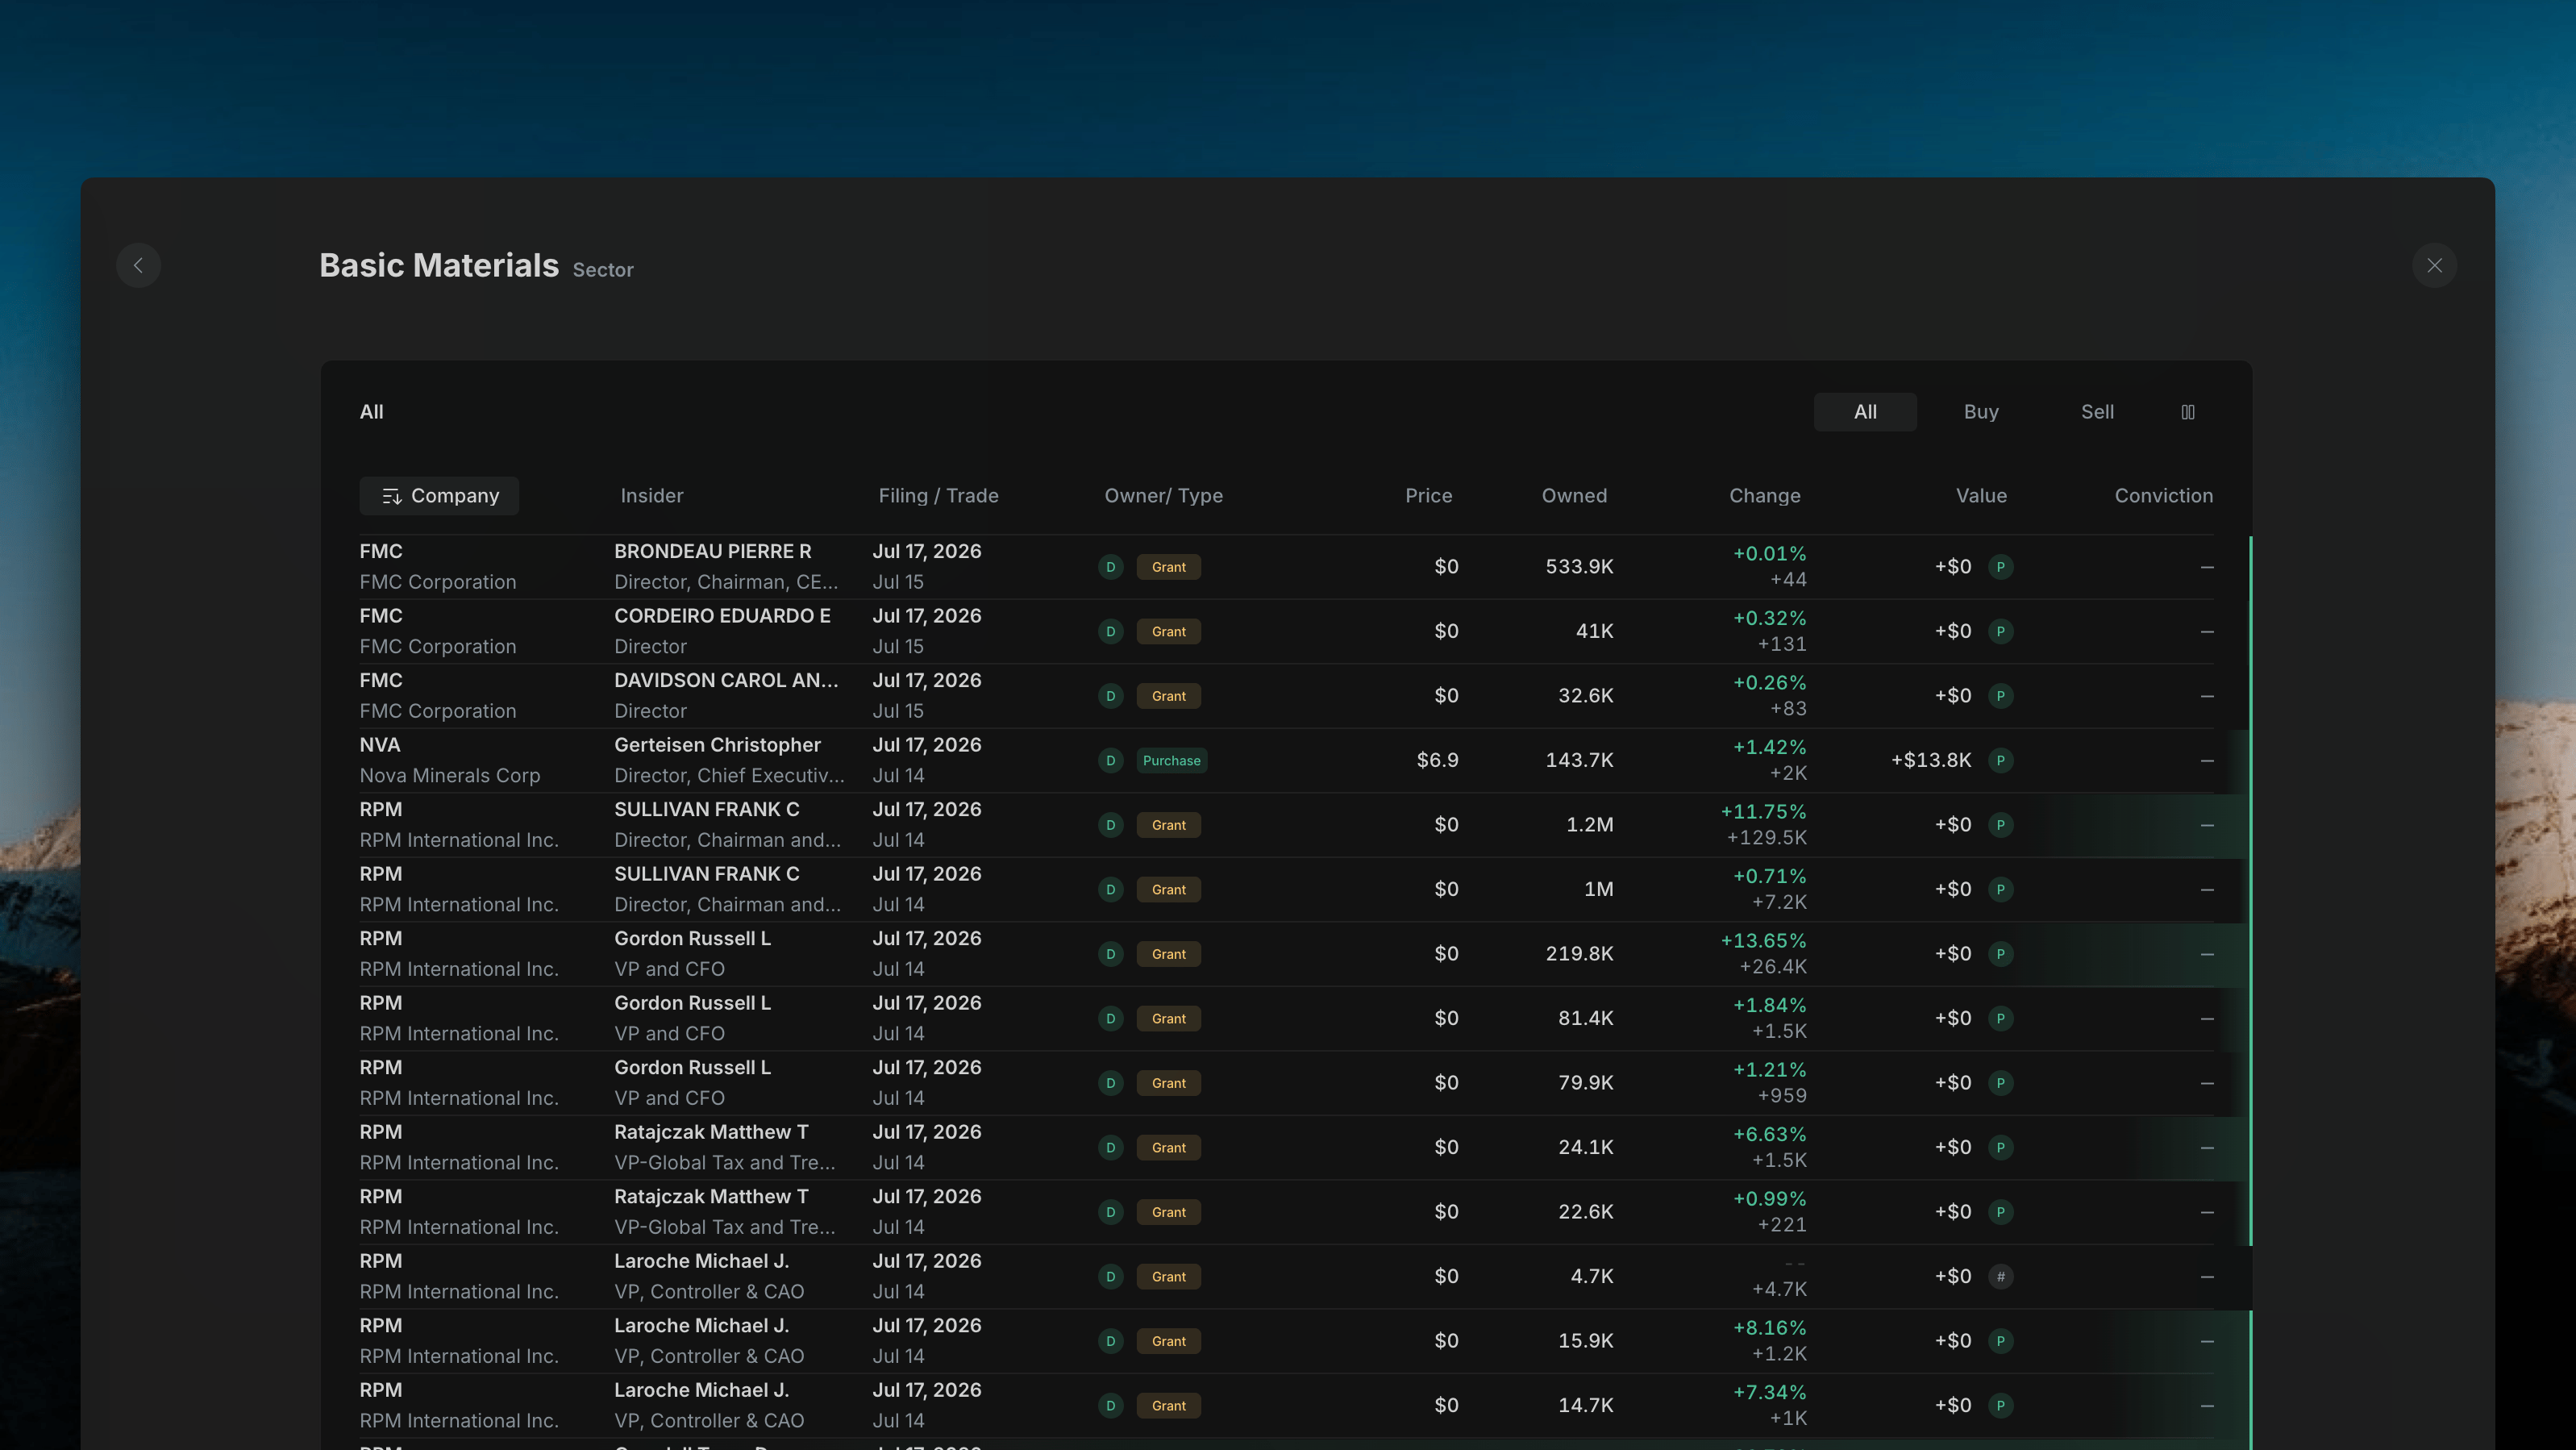
Sector Heat grid continued — bearish sectors like Energy, Consumer Defensive, and Financial Services
Cluster Table
At the bottom of the Charts view is a transaction table with three tabs: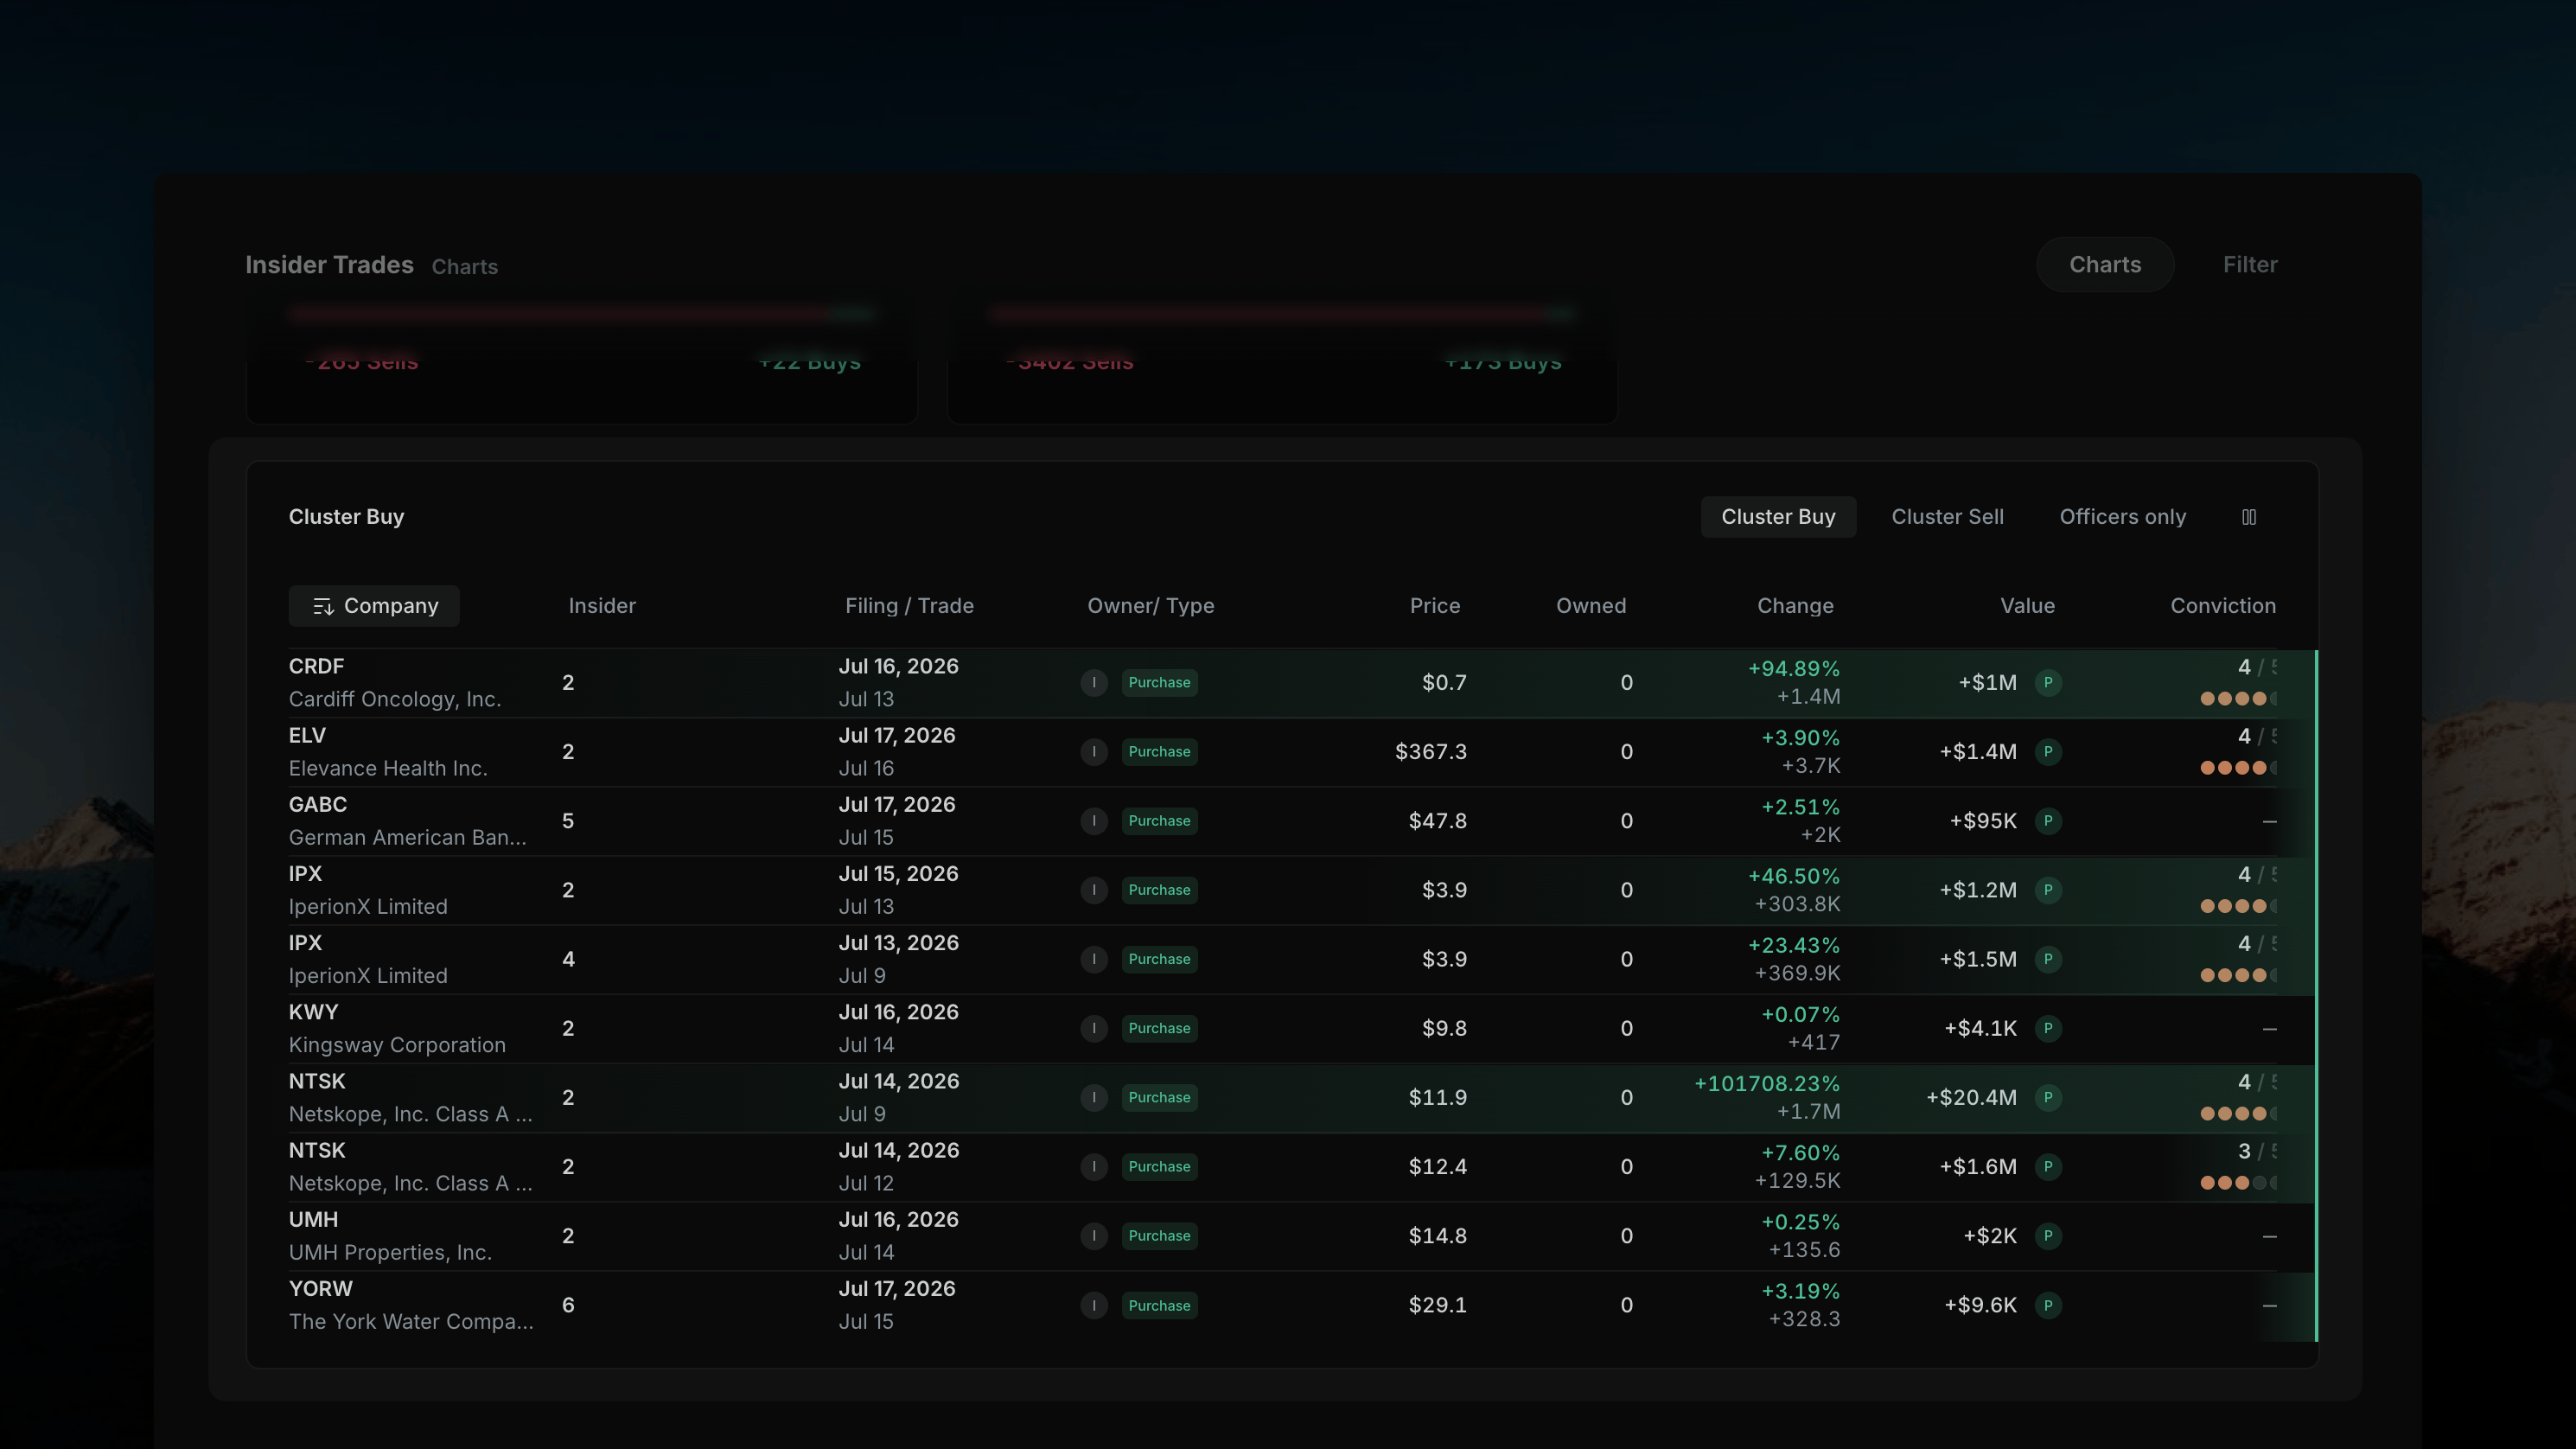
The Cluster Table — Cluster Buy tab with company, insider count, filing/trade dates, price, owned, change, value, and conviction columns
Detail Overlay
Clicking any card (a High-Conviction signal, a Sector Heat tile) or any row in the Cluster Table opens a detail overlay — not a separate page. The overlay shows every underlying transaction that rolls up into that card or row (e.g. clicking a sector tile shows every company and transaction driving that sector’s number; clicking a cluster row shows every insider in that cluster).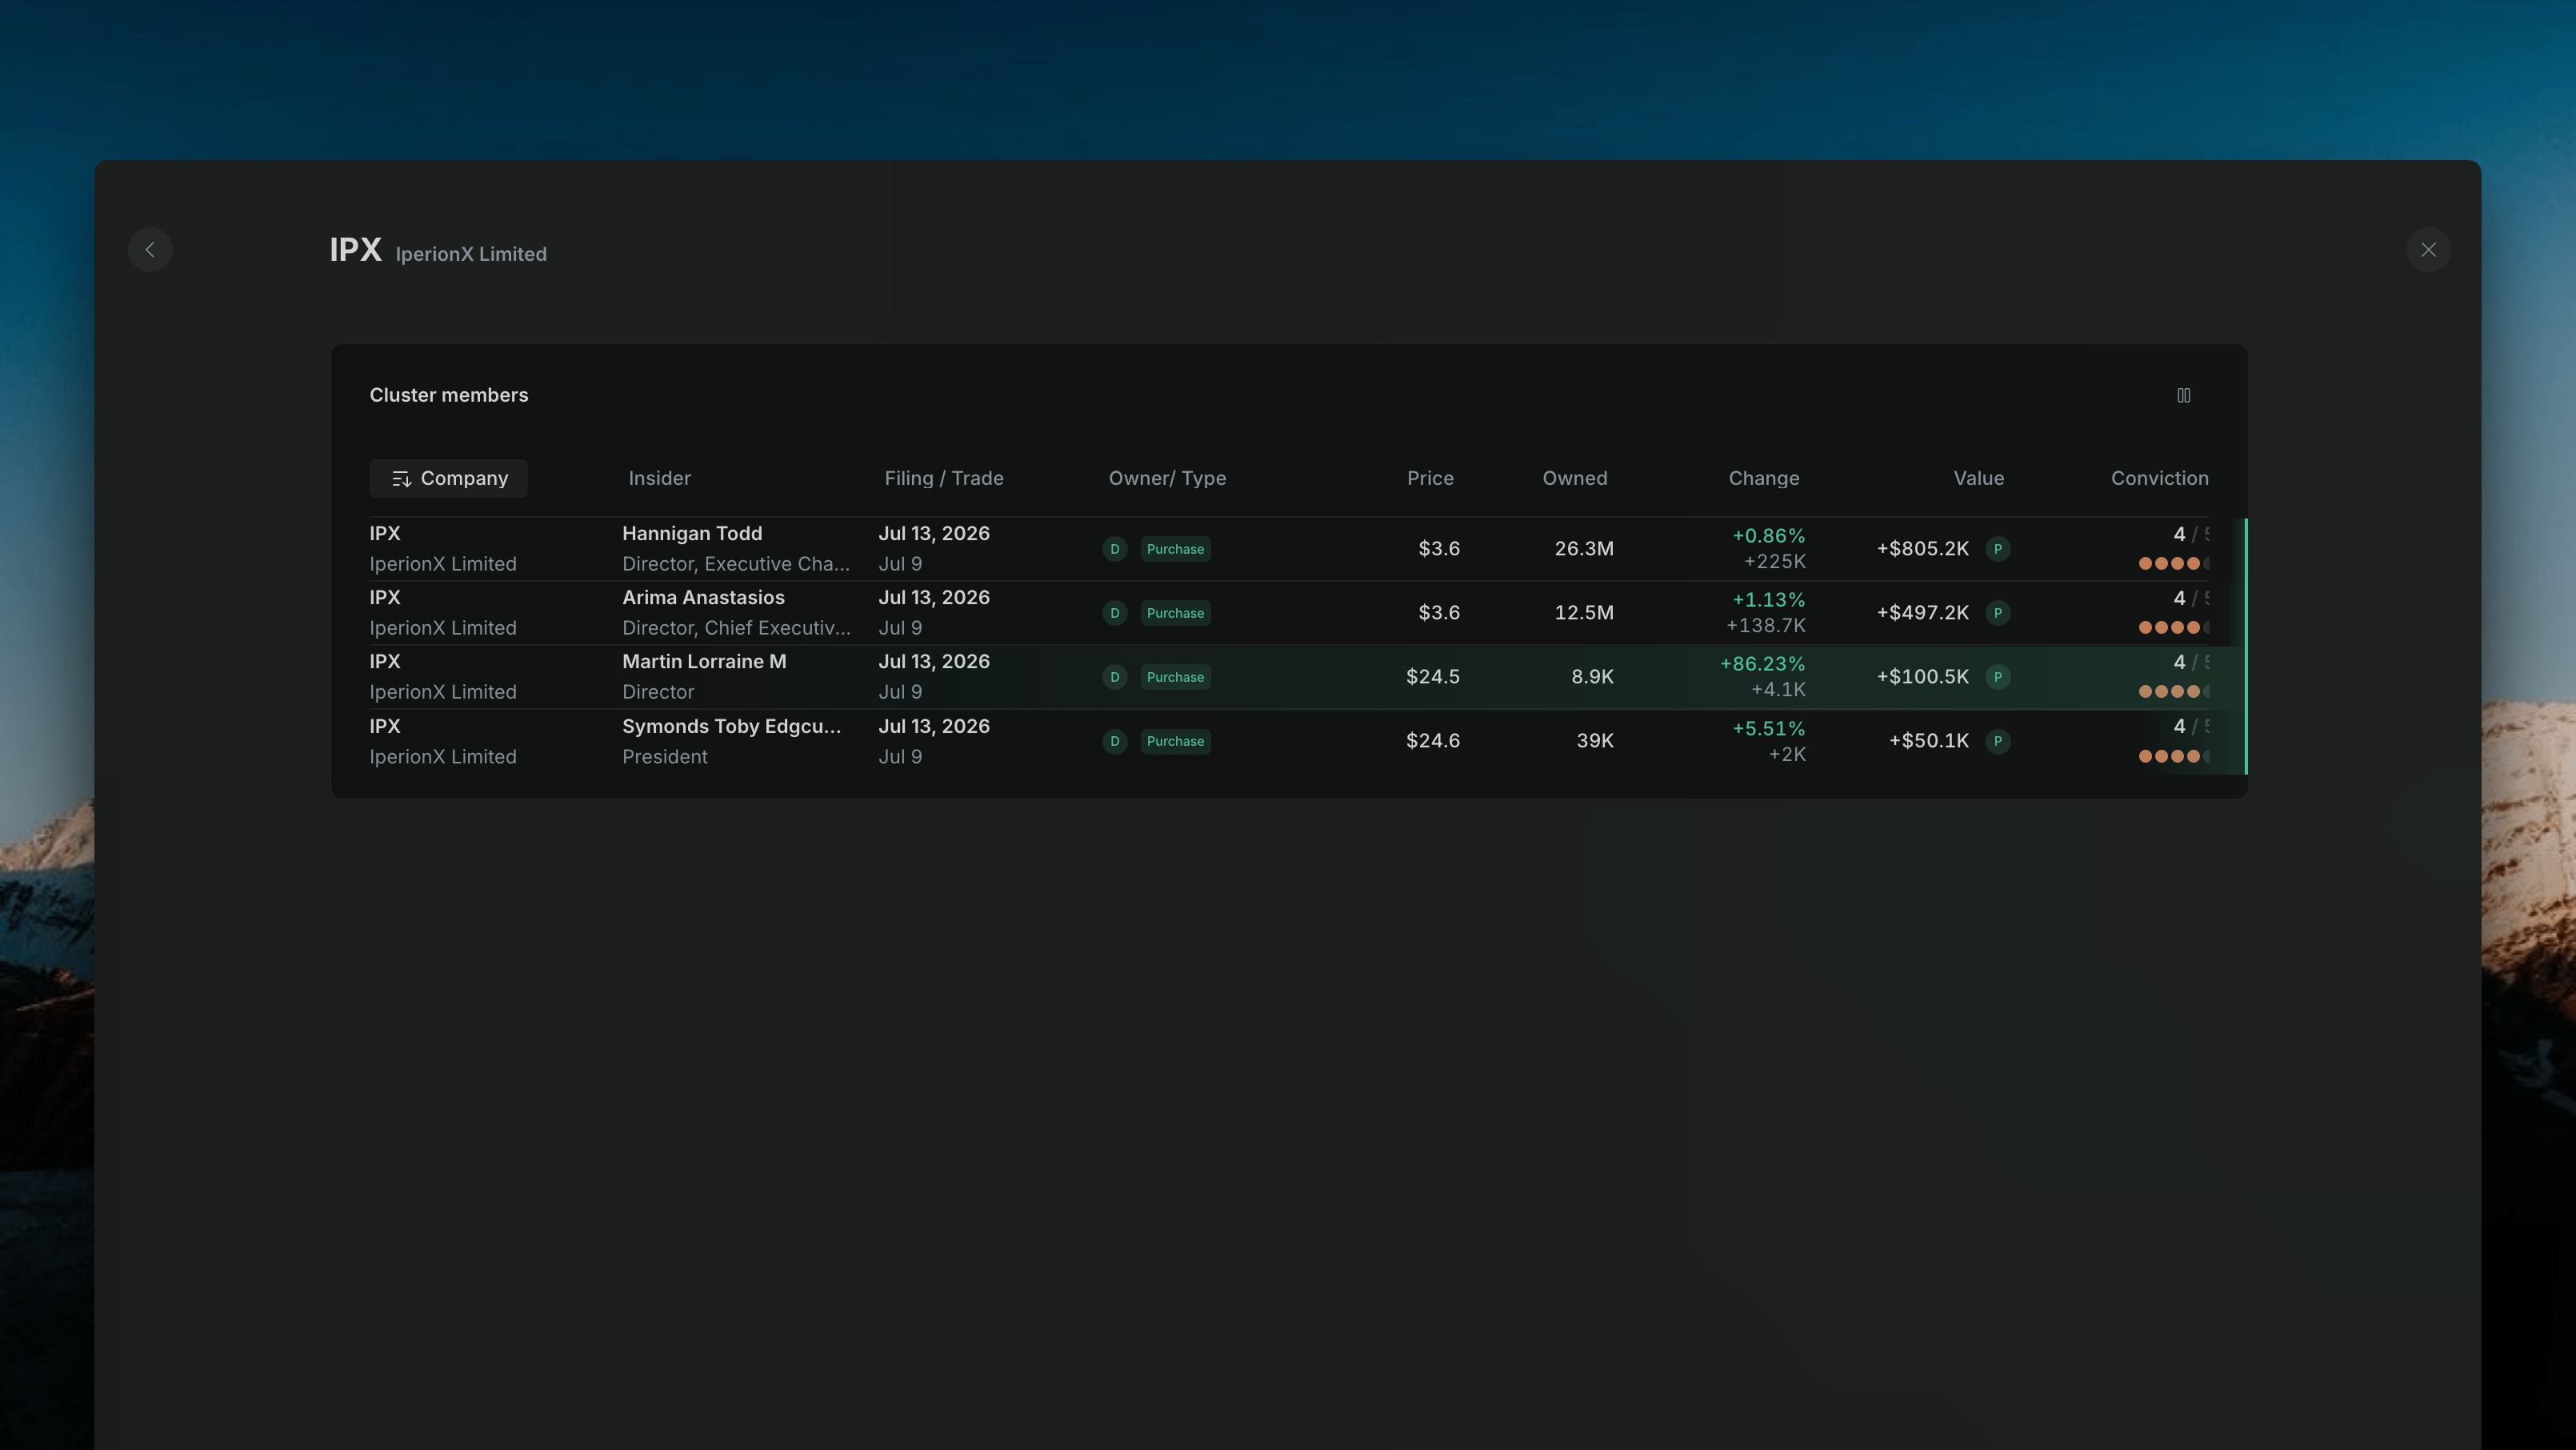
A detail overlay opened from the Cluster Table — every individual insider transaction rolling up into that row, shown without leaving the Charts view