> ## Documentation Index
> Fetch the complete documentation index at: https://docs.insighthread.com/llms.txt
> Use this file to discover all available pages before exploring further.
# Chart View
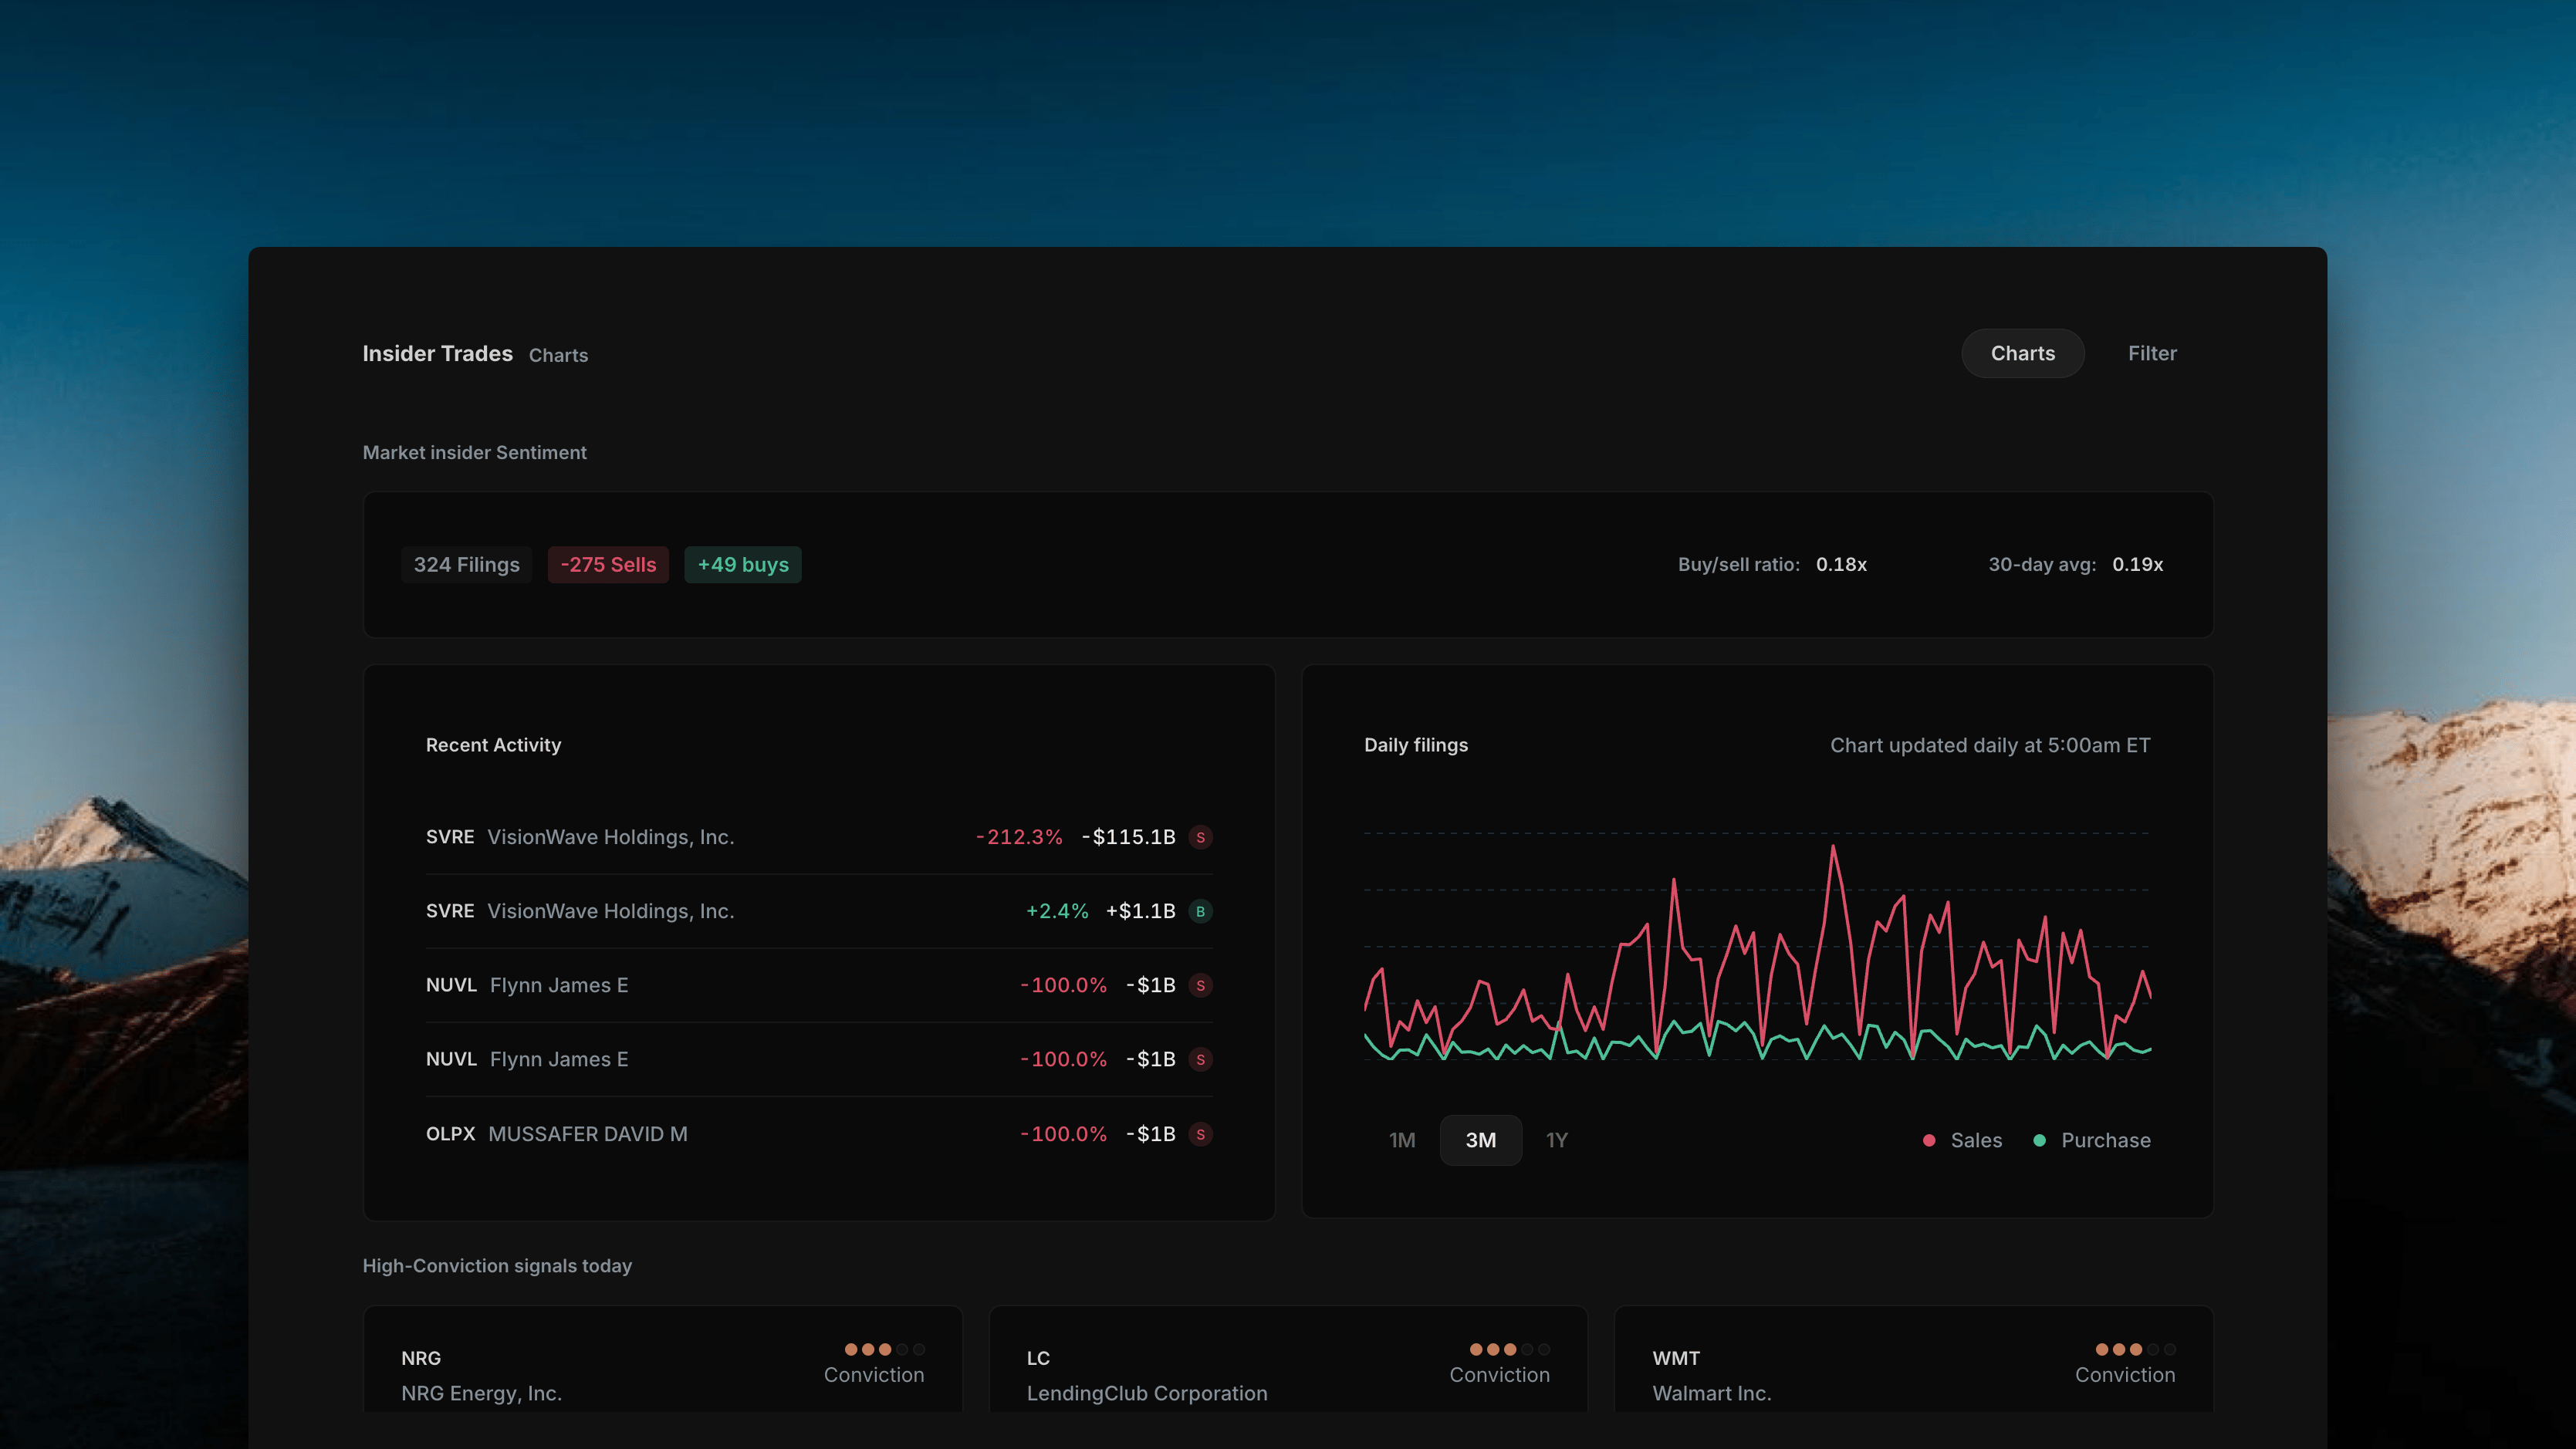
The Insider Trades page has two view modes, switchable from the top-right corner: **Filter** (see [Filter View](/insider-trades/filter-view)) and **Charts** (an aggregated, visual view of insider activity across the market). This page covers the Charts view.
 ***
## Market Insider Sentiment
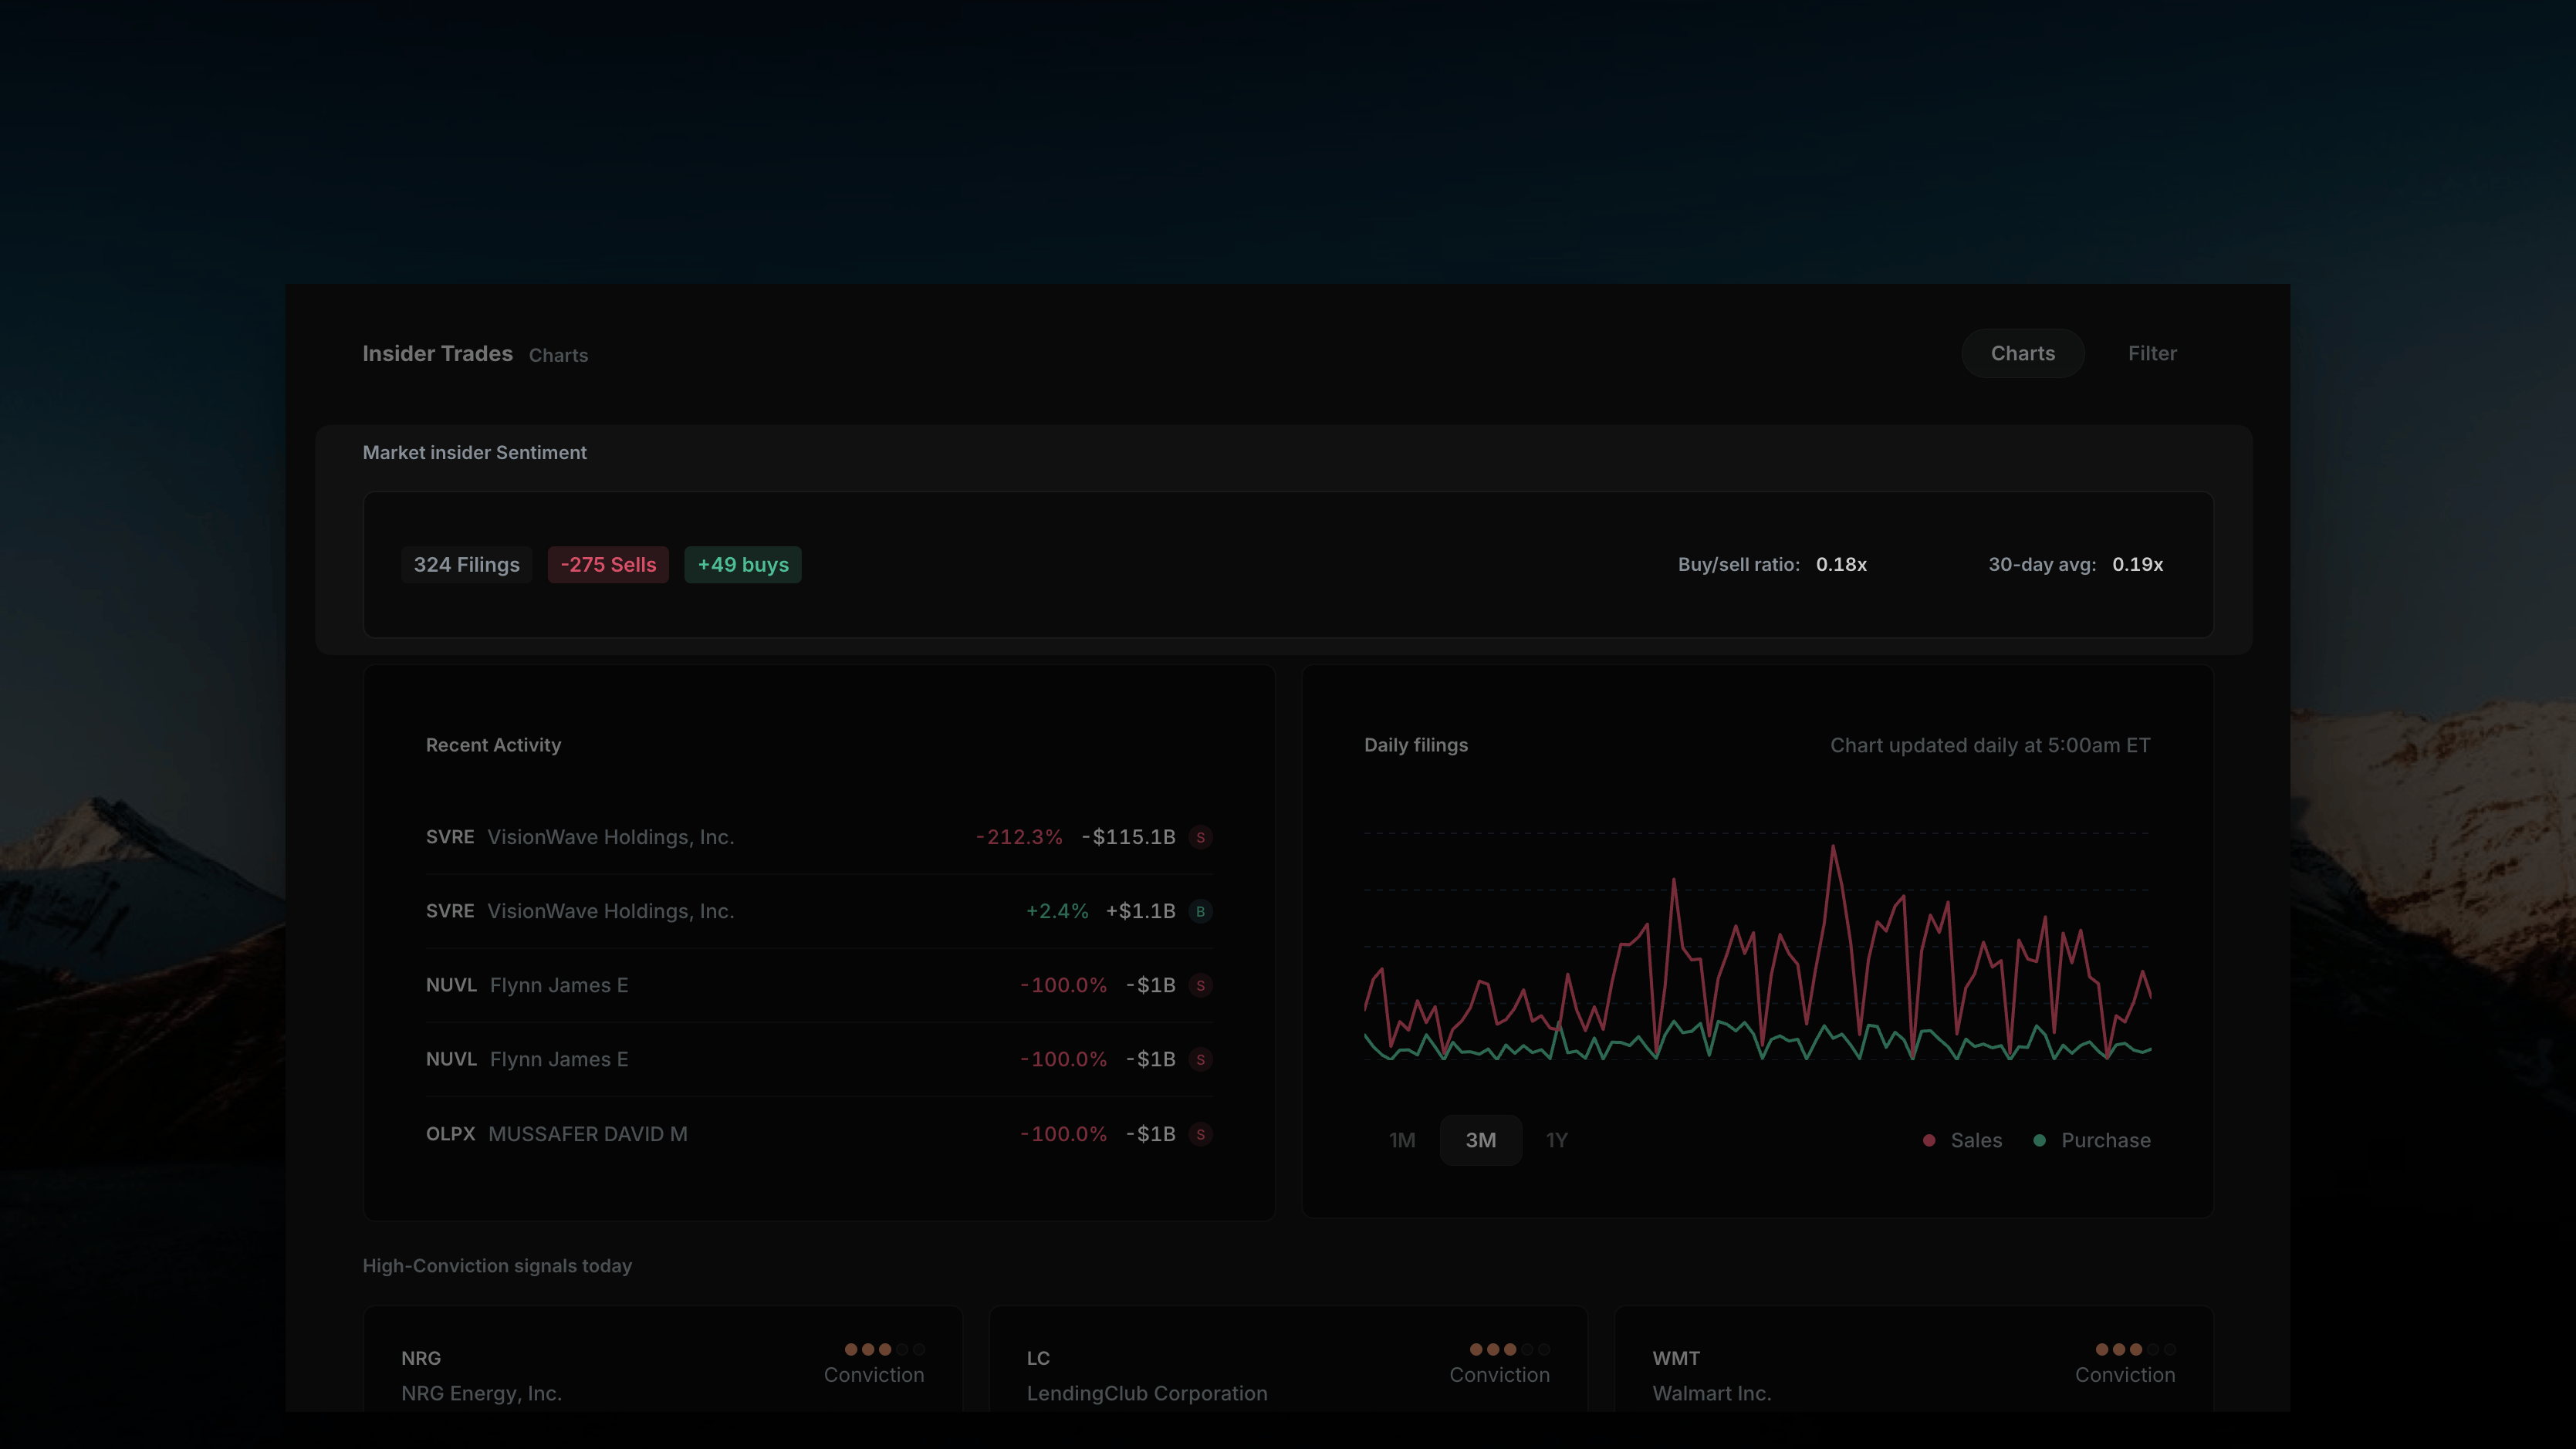
At the top of the Charts view, a single summary bar gives you the market-wide snapshot for the current period:
***
## Market Insider Sentiment
At the top of the Charts view, a single summary bar gives you the market-wide snapshot for the current period:
 | Element | Description |
| ------------------ | ------------------------------------------------------------------- |
| **Filings count** | Total number of Form 3/4/4-A filings processed (e.g. "324 Filings") |
| **Sells** | Total count of open-market sell transactions |
| **Buys** | Total count of open-market buy transactions |
| **Buy/sell ratio** | Ratio of buys to sells for the current period |
| **30-day avg** | The same ratio averaged over the trailing 30 days, for comparison |
Comparing the current ratio against the 30-day average is the fastest way to spot a market-wide shift in insider conviction.
***
## Recent Activity & Daily Filings
Below the sentiment bar, two panels sit side by side.
| Element | Description |
| ------------------ | ------------------------------------------------------------------- |
| **Filings count** | Total number of Form 3/4/4-A filings processed (e.g. "324 Filings") |
| **Sells** | Total count of open-market sell transactions |
| **Buys** | Total count of open-market buy transactions |
| **Buy/sell ratio** | Ratio of buys to sells for the current period |
| **30-day avg** | The same ratio averaged over the trailing 30 days, for comparison |
Comparing the current ratio against the 30-day average is the fastest way to spot a market-wide shift in insider conviction.
***
## Recent Activity & Daily Filings
Below the sentiment bar, two panels sit side by side.
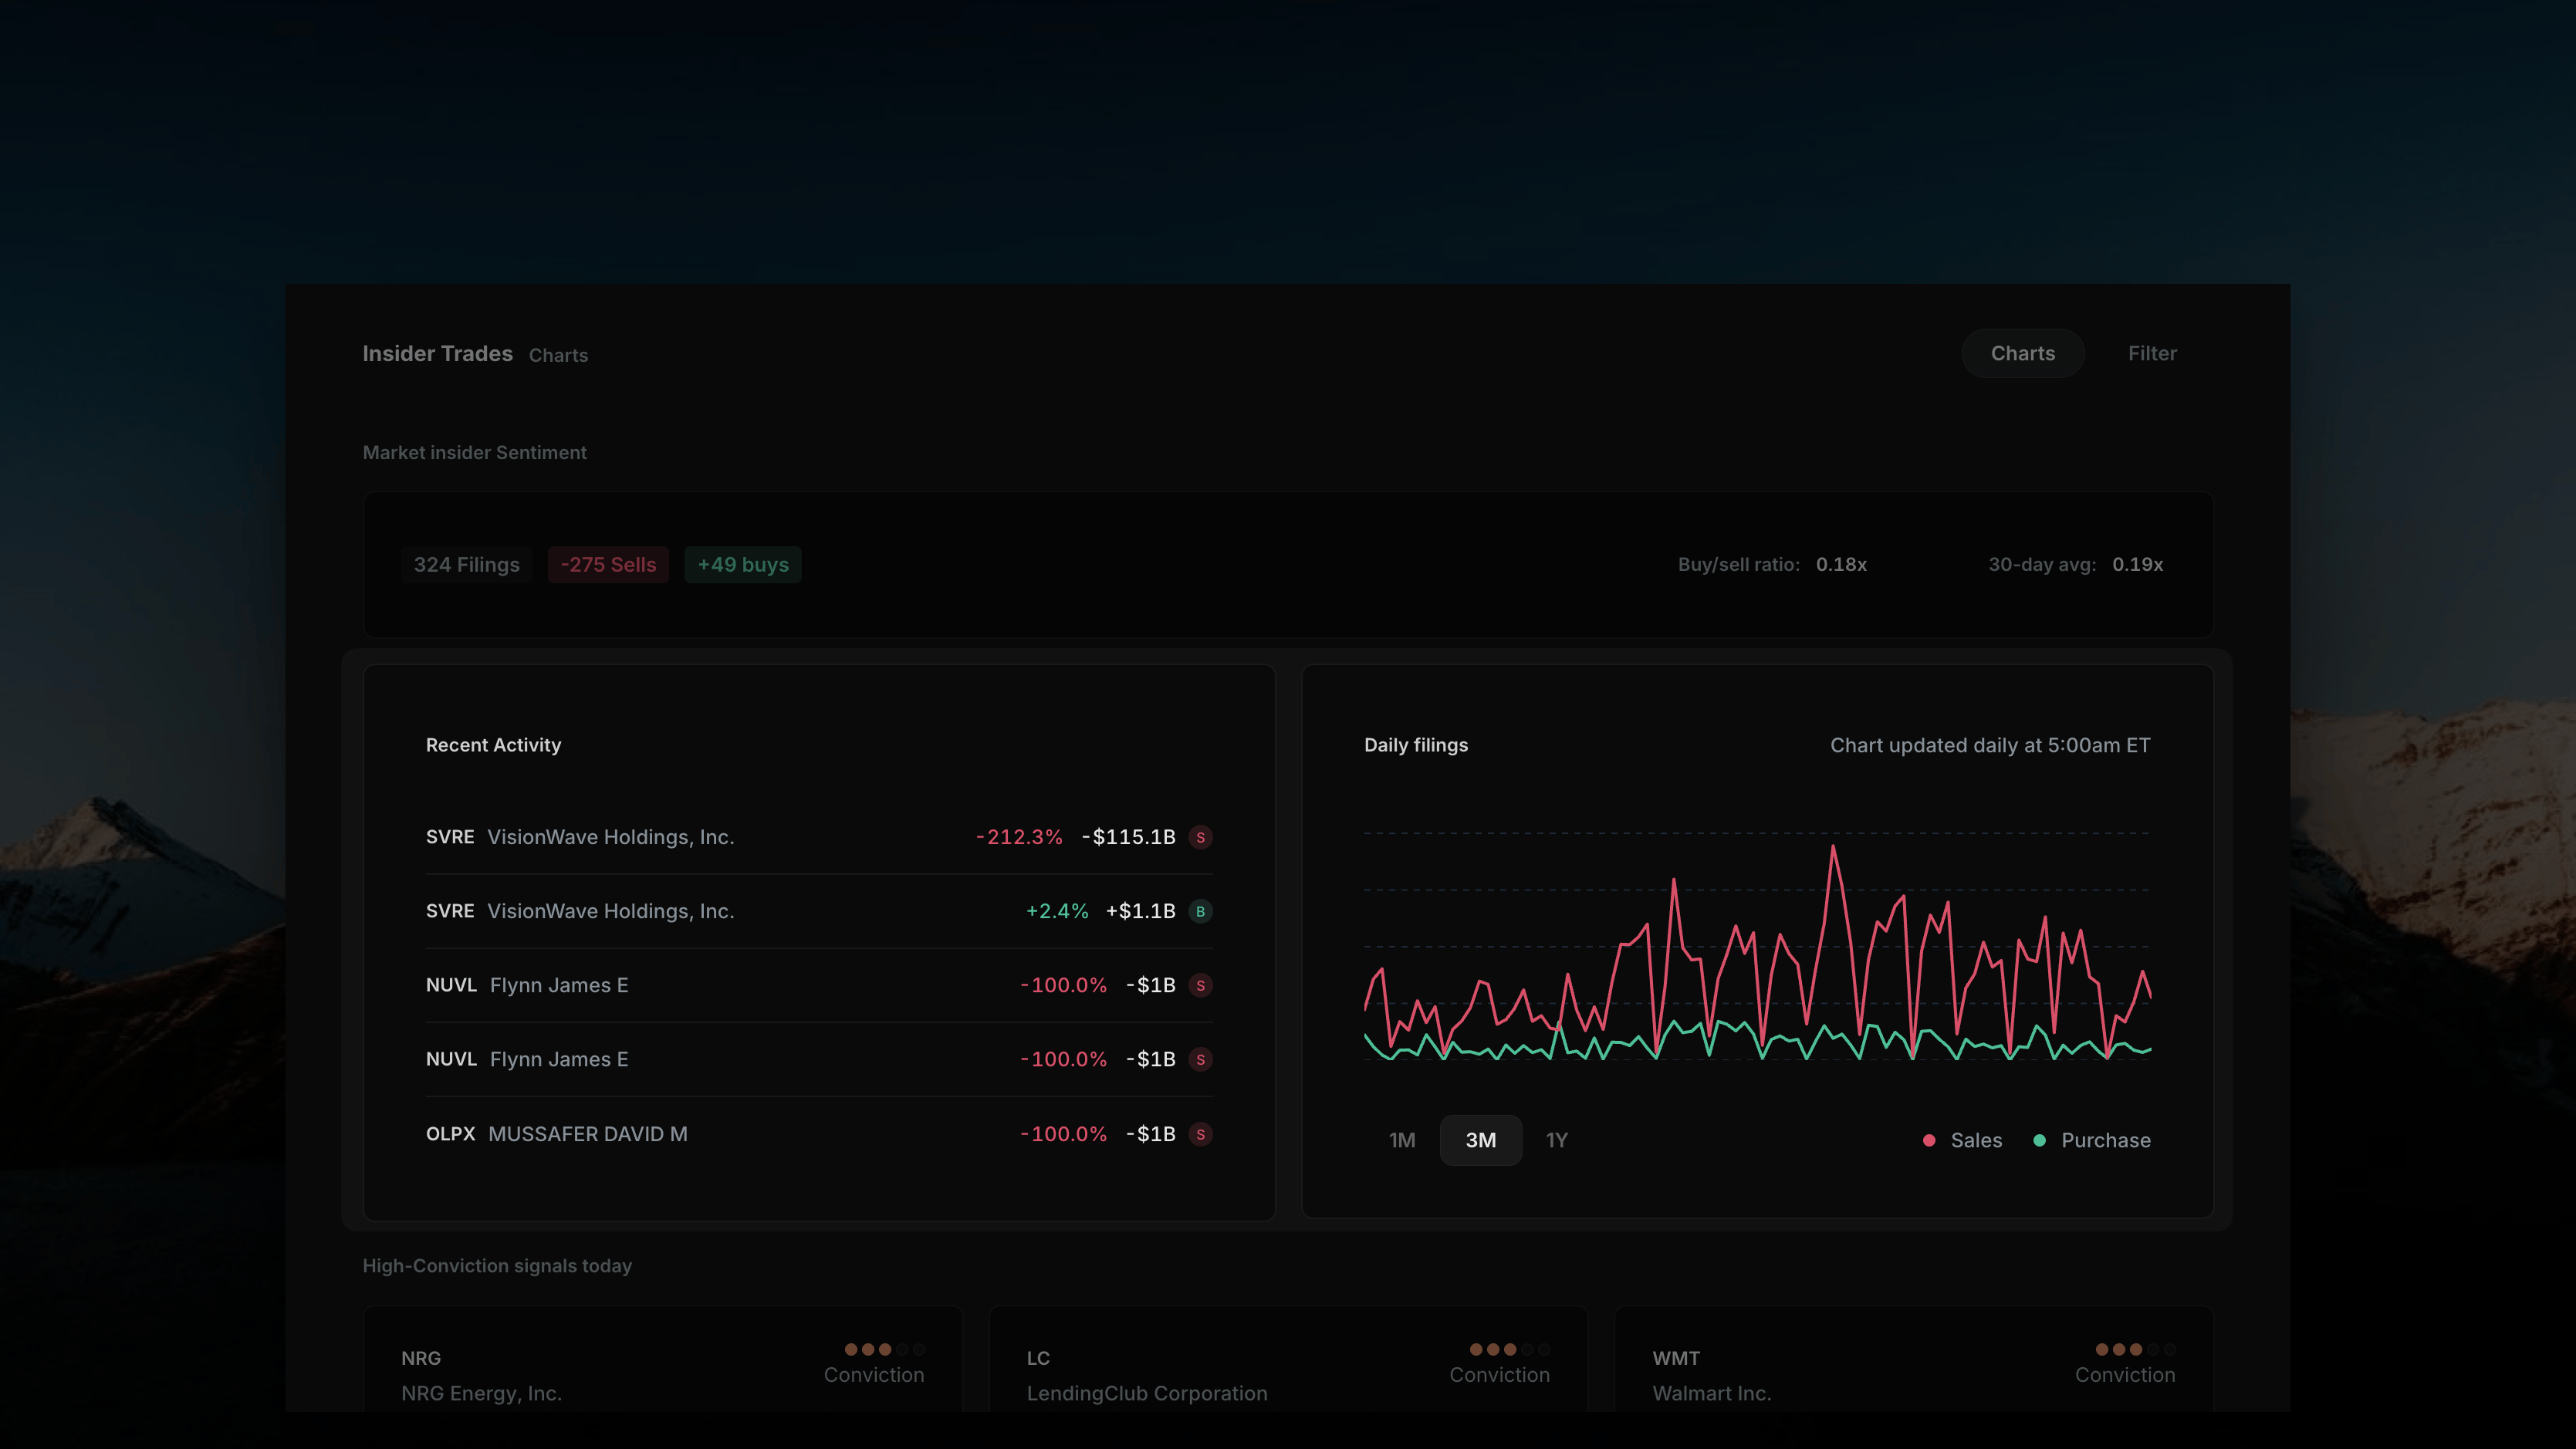 A live list of the most recent individual insider transactions — ticker, company name, percent change in position, dollar value, and a Buy/Sell badge.
A line chart plotting daily Sales vs. Purchases over time. Switch between **1M**, **3M**, and **1Y** windows. The chart updates daily at 5:00am ET as new filings are processed.
***
## High-Conviction Signals Today
This section surfaces the day's most significant transactions as individual cards, one per ticker. Each card shows:
A live list of the most recent individual insider transactions — ticker, company name, percent change in position, dollar value, and a Buy/Sell badge.
A line chart plotting daily Sales vs. Purchases over time. Switch between **1M**, **3M**, and **1Y** windows. The chart updates daily at 5:00am ET as new filings are processed.
***
## High-Conviction Signals Today
This section surfaces the day's most significant transactions as individual cards, one per ticker. Each card shows:
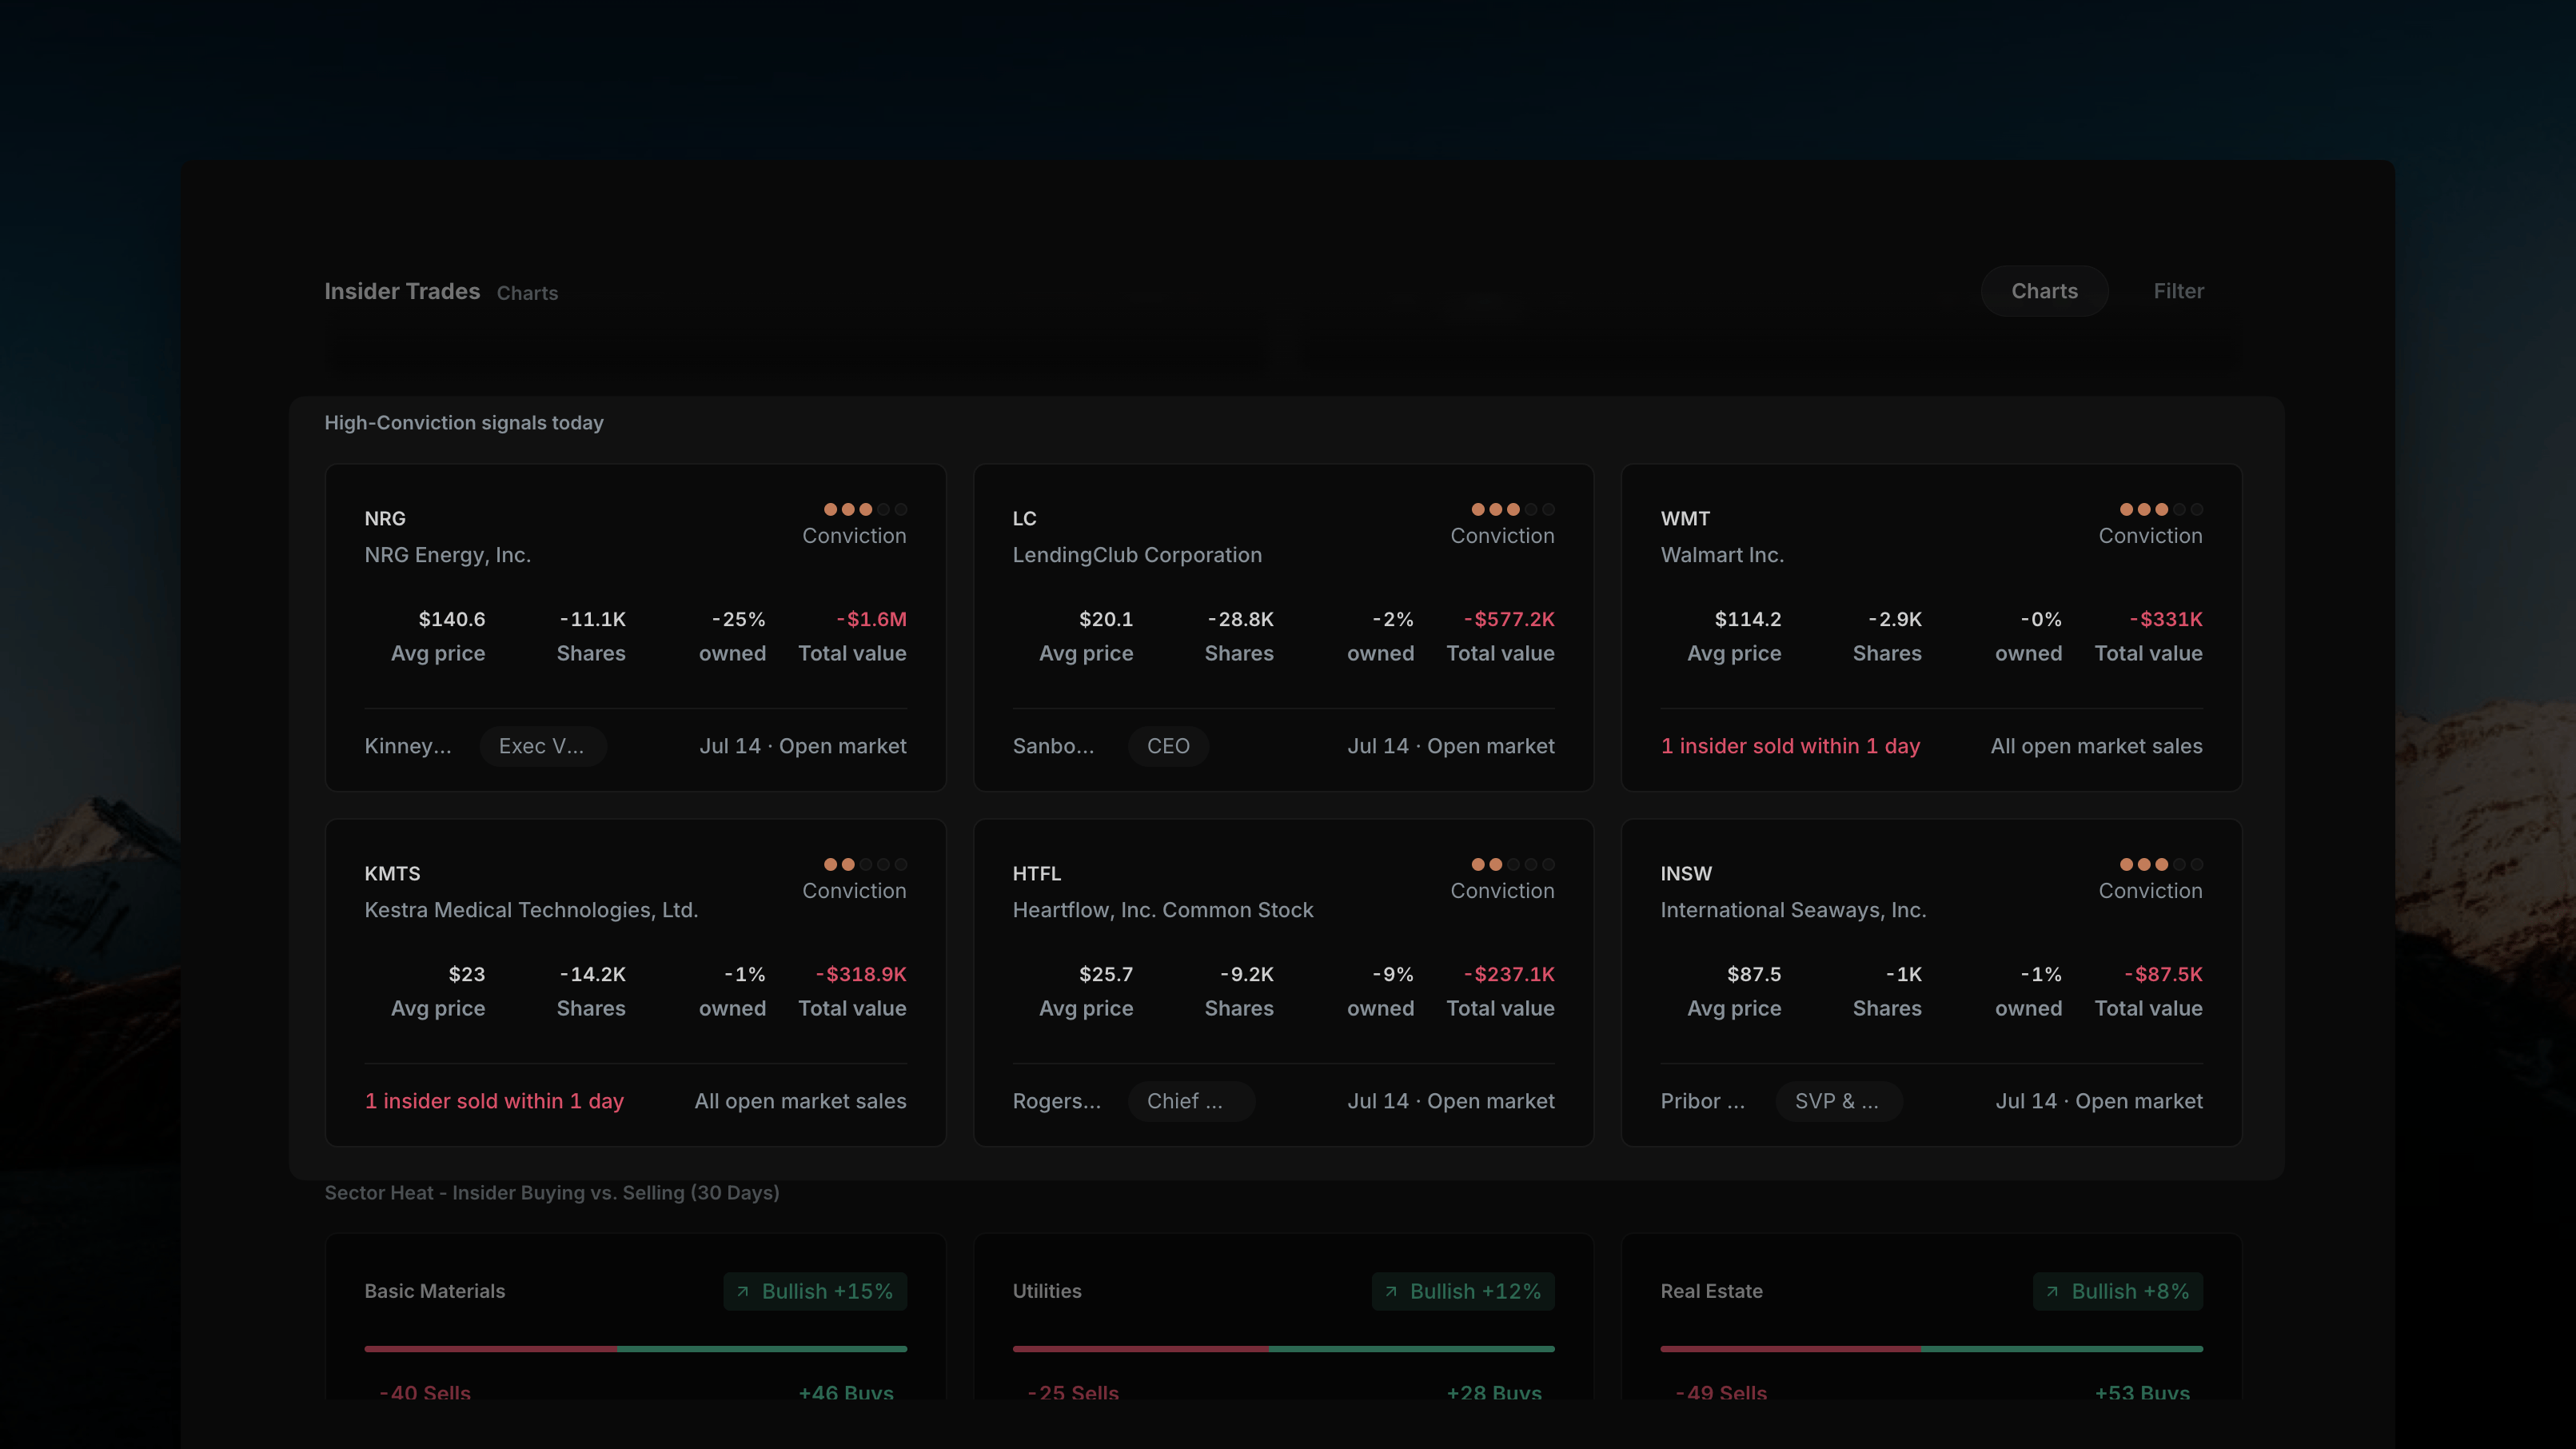 * **Conviction dots** — a proprietary score (see [Conviction Scoring](/features/insider-trades#conviction-scoring)) shown as a filled-dot meter in the top-right of the card
* **Avg price**, **Shares** change, **% owned** change, and **Total value** of the transaction
* The **insider's name and title** (e.g. Director, CEO, EVP)
* The **filing date** and trade type (e.g. "Jul 14 · Open market")
* A contextual note where relevant, e.g. "1 insider sold within 1 day" or "All open market sales"
Conviction scoring here weighs who is transacting, the transaction type, and how it compares to that insider's past activity — not just the raw dollar amount.
***
## Sector Heat — Insider Buying vs. Selling (30 Days)
A grid of sector tiles shows net insider direction by sector over a trailing 30-day window. Each tile has:
* **Conviction dots** — a proprietary score (see [Conviction Scoring](/features/insider-trades#conviction-scoring)) shown as a filled-dot meter in the top-right of the card
* **Avg price**, **Shares** change, **% owned** change, and **Total value** of the transaction
* The **insider's name and title** (e.g. Director, CEO, EVP)
* The **filing date** and trade type (e.g. "Jul 14 · Open market")
* A contextual note where relevant, e.g. "1 insider sold within 1 day" or "All open market sales"
Conviction scoring here weighs who is transacting, the transaction type, and how it compares to that insider's past activity — not just the raw dollar amount.
***
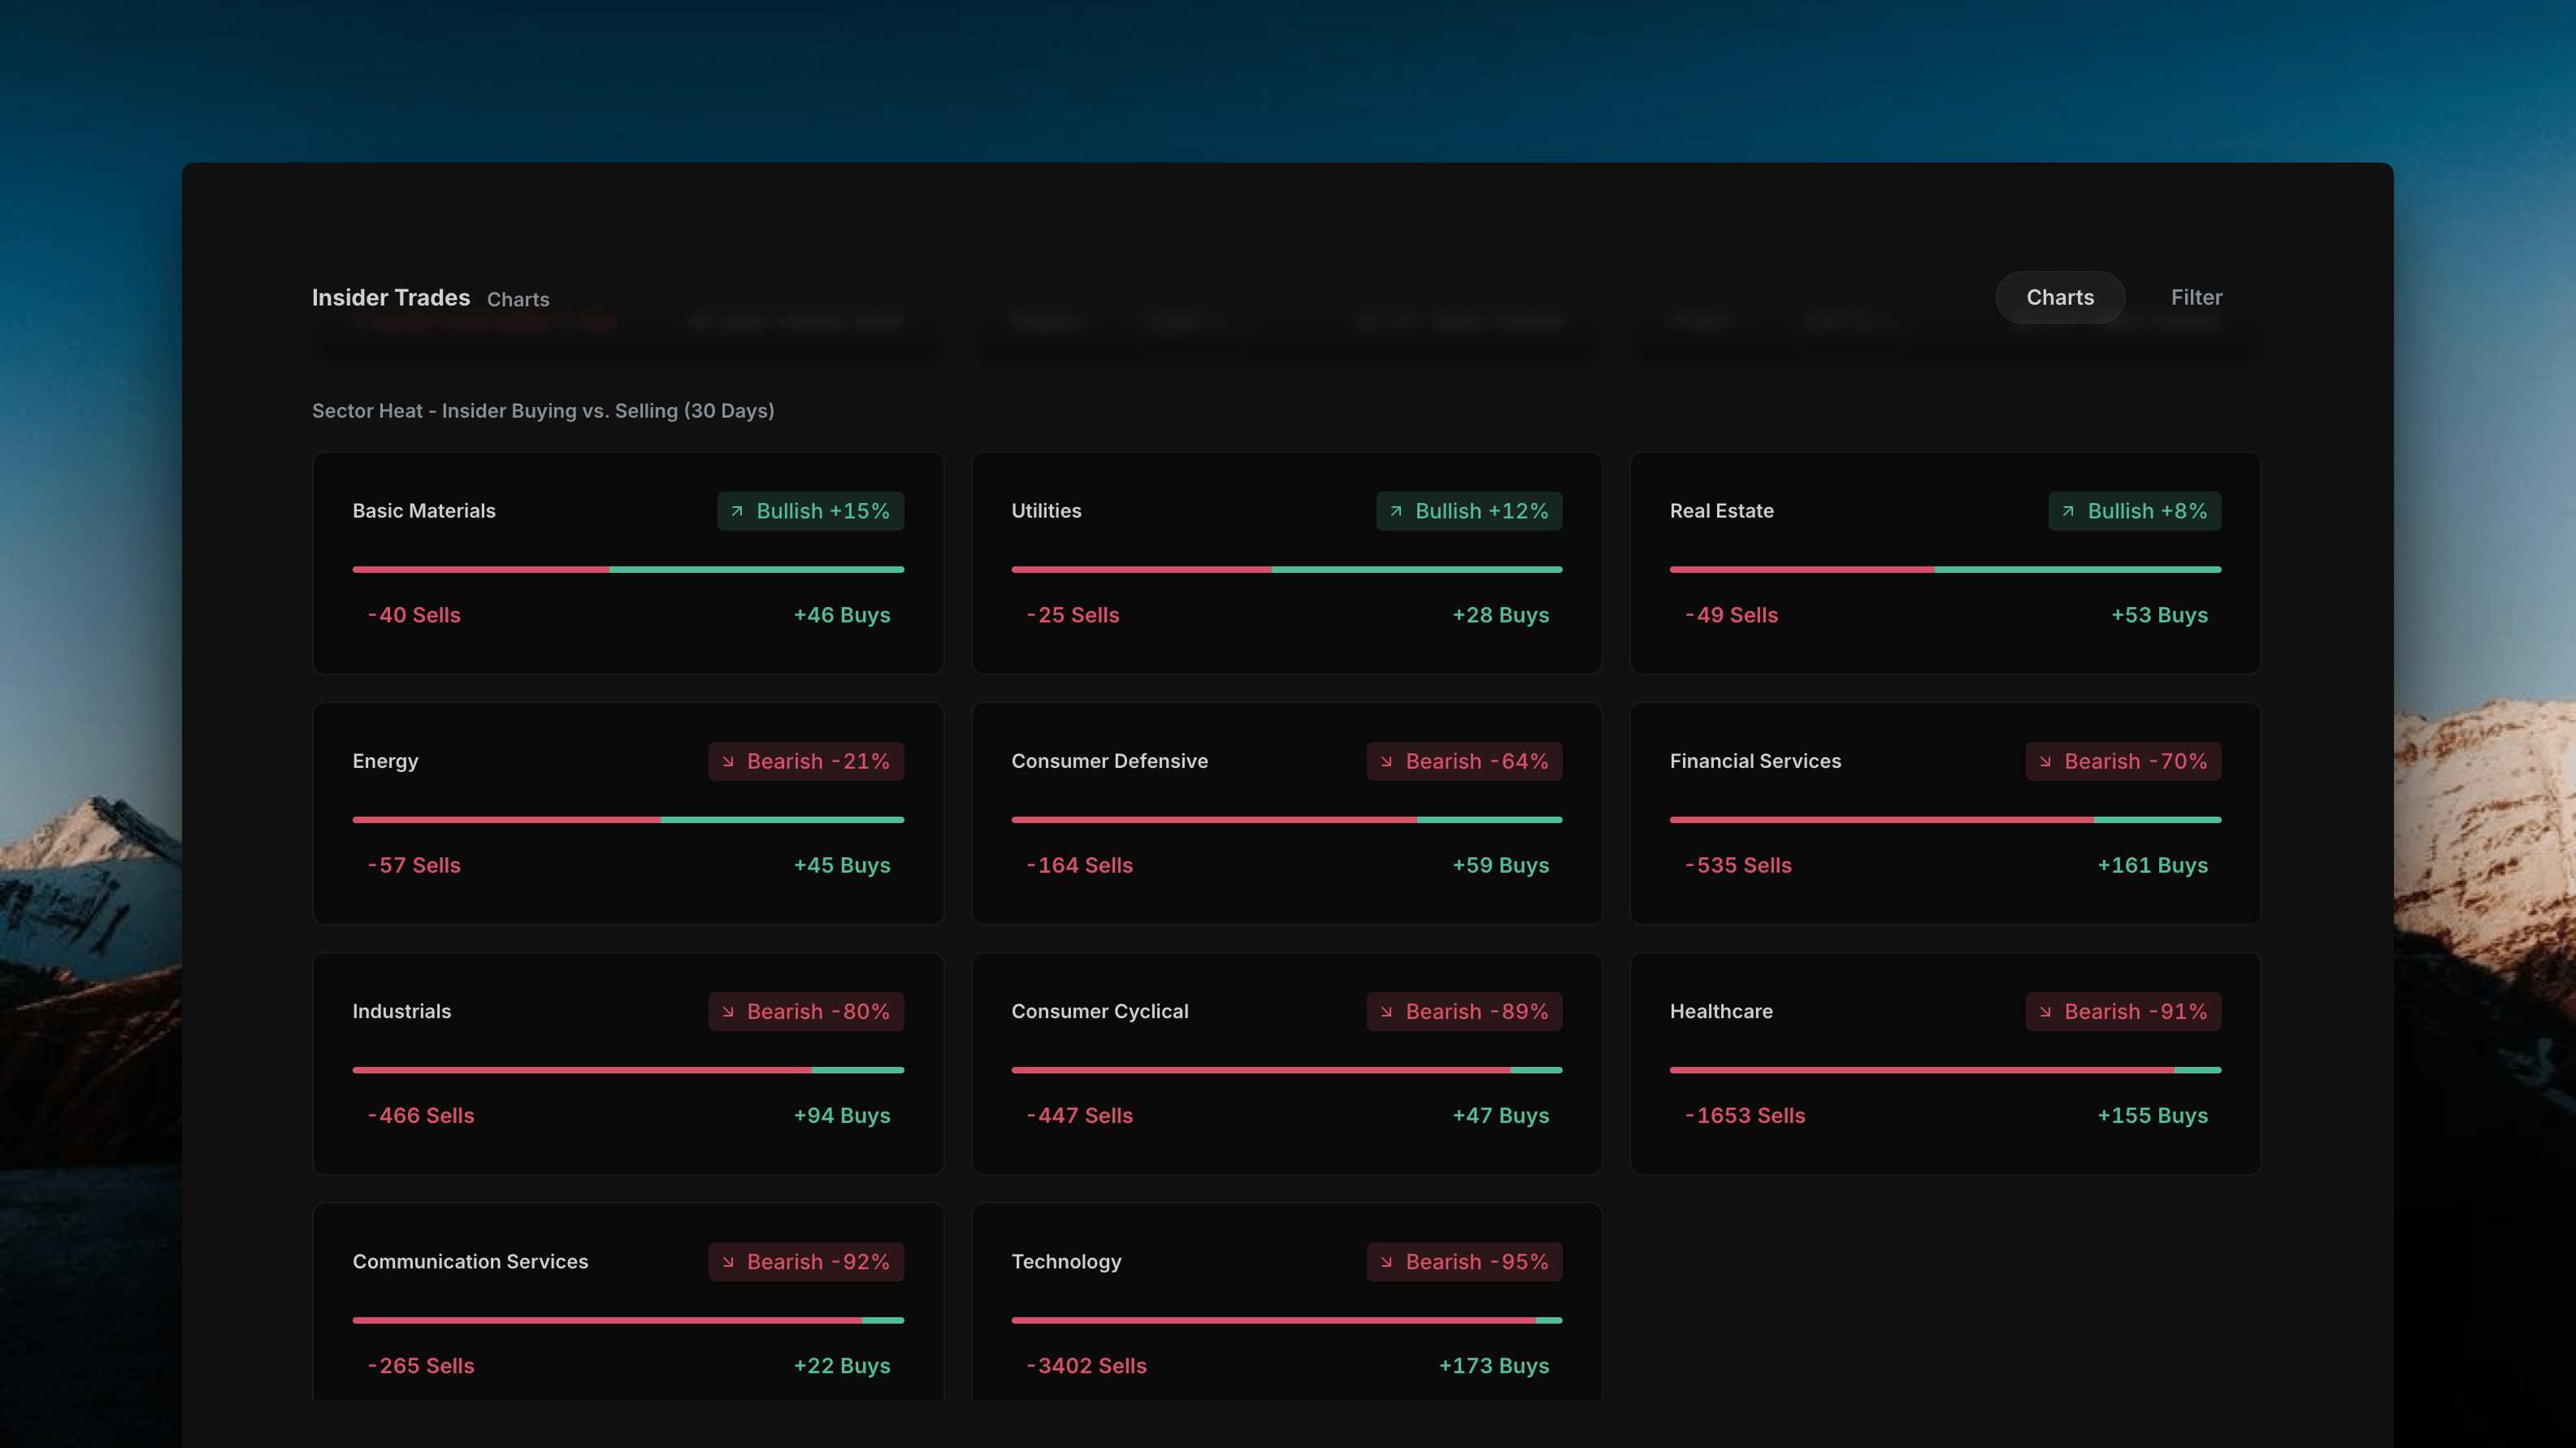
## Sector Heat — Insider Buying vs. Selling (30 Days)
A grid of sector tiles shows net insider direction by sector over a trailing 30-day window. Each tile has:
 * The **sector name**
* A **Bullish/Bearish badge** with a net percentage (e.g. "Bullish +15%", "Bearish -95%")
* A **horizontal Sells/Buys bar**, with the split visualized in red (sells) and green (buys)
* Raw counts: **-X Sells** and **+Y Buys**
* The **sector name**
* A **Bullish/Bearish badge** with a net percentage (e.g. "Bullish +15%", "Bearish -95%")
* A **horizontal Sells/Buys bar**, with the split visualized in red (sells) and green (buys)
* Raw counts: **-X Sells** and **+Y Buys**
 This is the same underlying signal covered in [Sector Heat Maps](/features/insider-trades#sector-heat-maps), rendered here as a scannable grid rather than a single map.
***
## Cluster Table
At the bottom of the Charts view is a transaction table with three tabs:
This is the same underlying signal covered in [Sector Heat Maps](/features/insider-trades#sector-heat-maps), rendered here as a scannable grid rather than a single map.
***
## Cluster Table
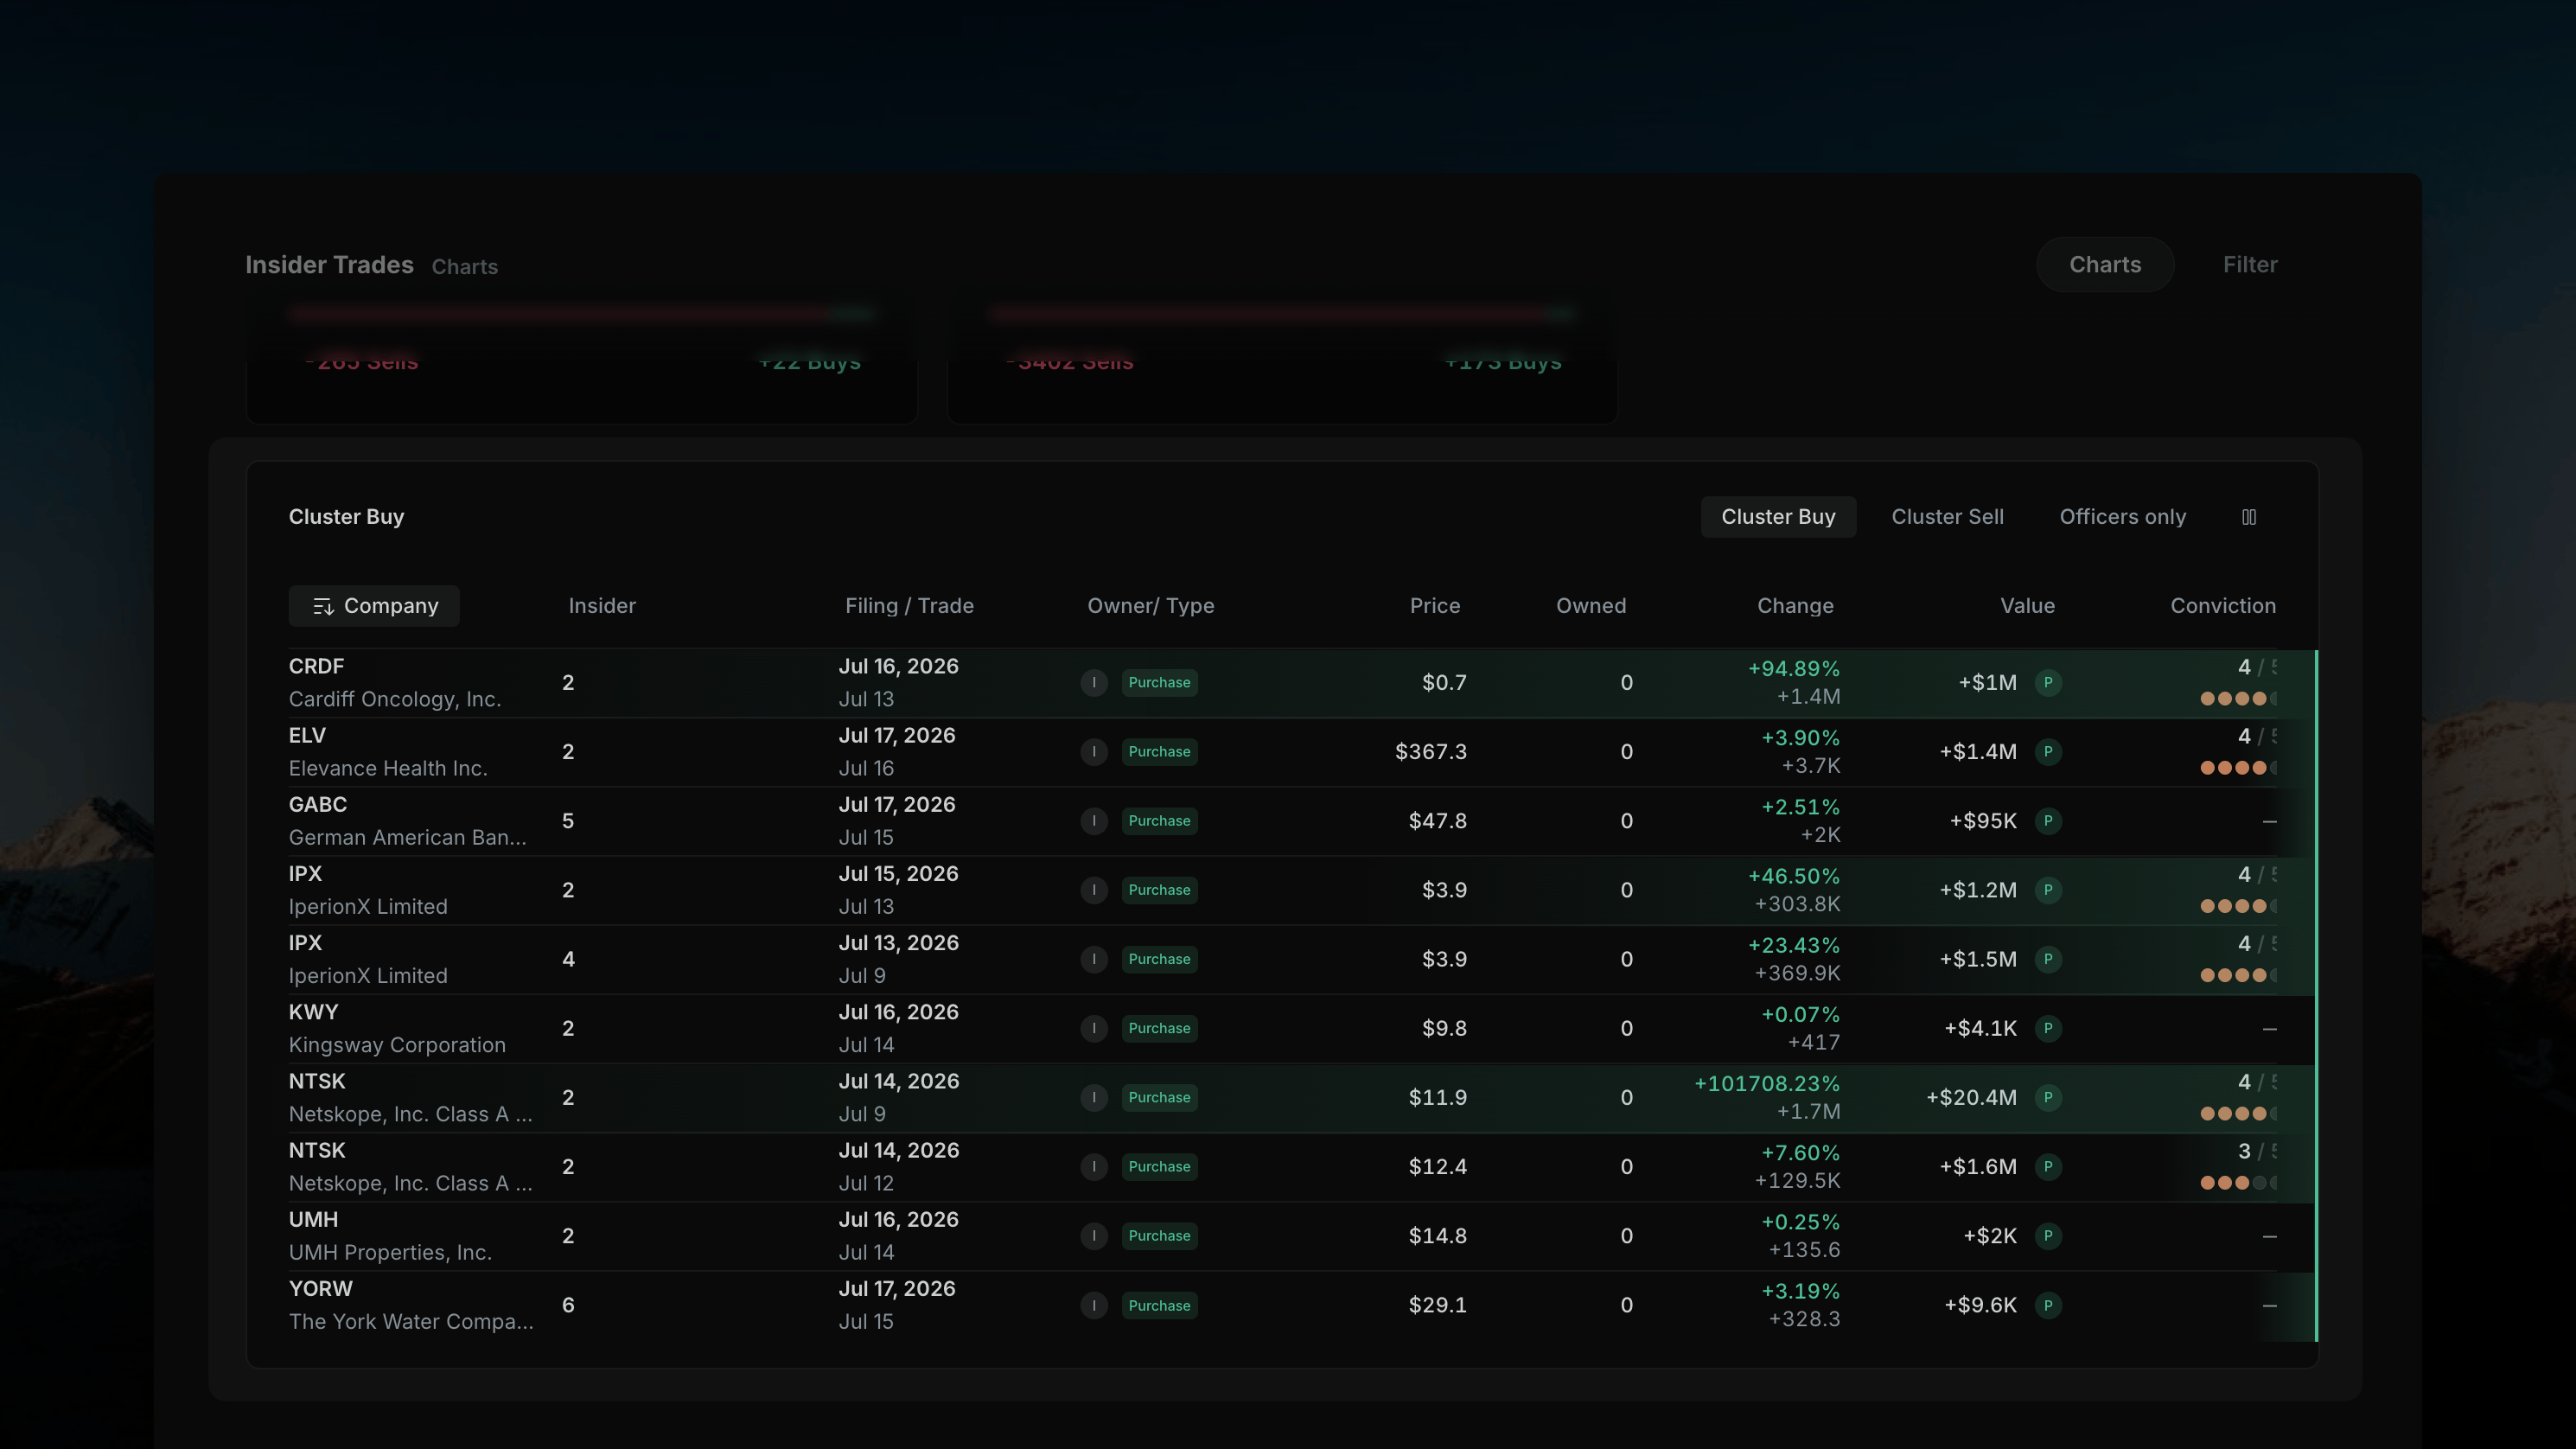
At the bottom of the Charts view is a transaction table with three tabs:
 | Tab | Shows |
| ----------------- | ------------------------------------------------------------------ |
| **Cluster Buy** | Companies where multiple insiders bought within the cluster window |
| **Cluster Sell** | Companies where multiple insiders sold within the cluster window |
| **Officers only** | Restricts the table to officer-level insiders (CEO, CFO, etc.) |
Columns: **Company**, **Insider** (count), **Filing/Trade** (dates), **Owner/Type**, **Price**, **Owned**, **Change**, **Value**, **Conviction**.
A column-visibility icon in the top-right lets you hide any columns you don't need — useful for narrowing the table to just the fields you care about.
***
## Detail Overlay
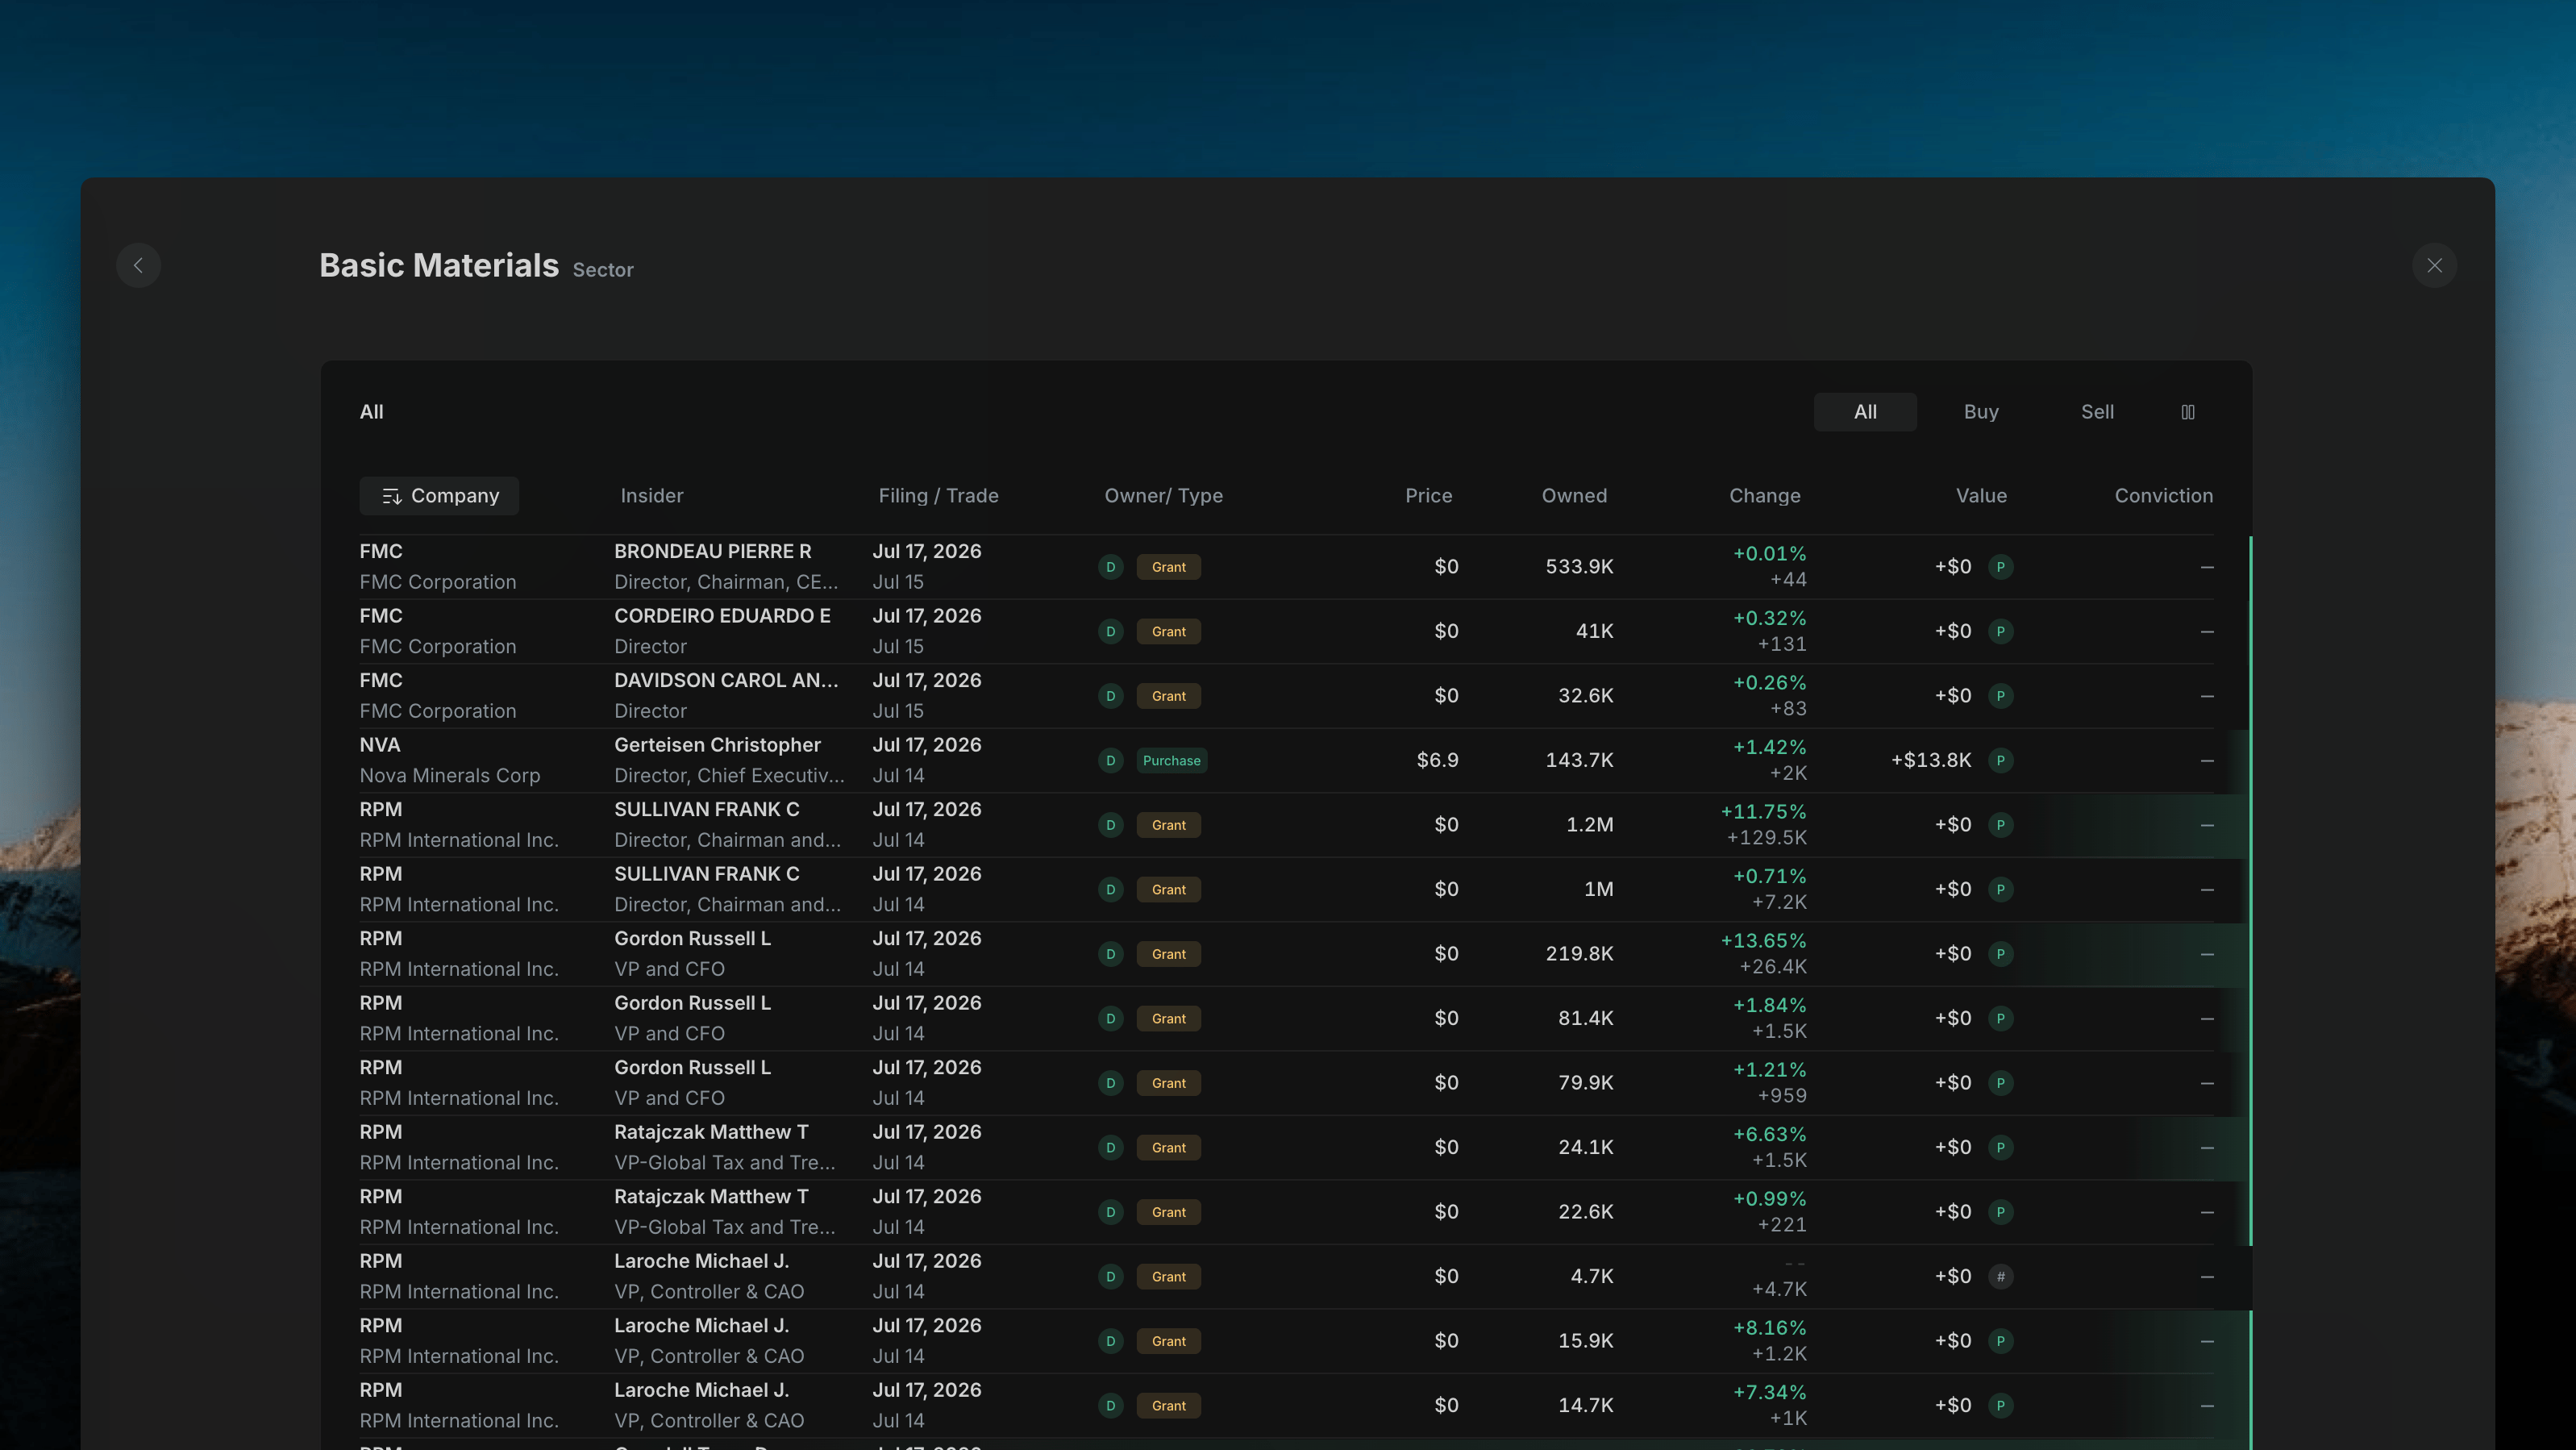
Clicking any card (a High-Conviction signal, a Sector Heat tile) or any row in the Cluster Table opens a **detail overlay** — not a separate page. The overlay shows every underlying transaction that rolls up into that card or row (e.g. clicking a sector tile shows every company and transaction driving that sector's number; clicking a cluster row shows every insider in that cluster).
| Tab | Shows |
| ----------------- | ------------------------------------------------------------------ |
| **Cluster Buy** | Companies where multiple insiders bought within the cluster window |
| **Cluster Sell** | Companies where multiple insiders sold within the cluster window |
| **Officers only** | Restricts the table to officer-level insiders (CEO, CFO, etc.) |
Columns: **Company**, **Insider** (count), **Filing/Trade** (dates), **Owner/Type**, **Price**, **Owned**, **Change**, **Value**, **Conviction**.
A column-visibility icon in the top-right lets you hide any columns you don't need — useful for narrowing the table to just the fields you care about.
***
## Detail Overlay
Clicking any card (a High-Conviction signal, a Sector Heat tile) or any row in the Cluster Table opens a **detail overlay** — not a separate page. The overlay shows every underlying transaction that rolls up into that card or row (e.g. clicking a sector tile shows every company and transaction driving that sector's number; clicking a cluster row shows every insider in that cluster).
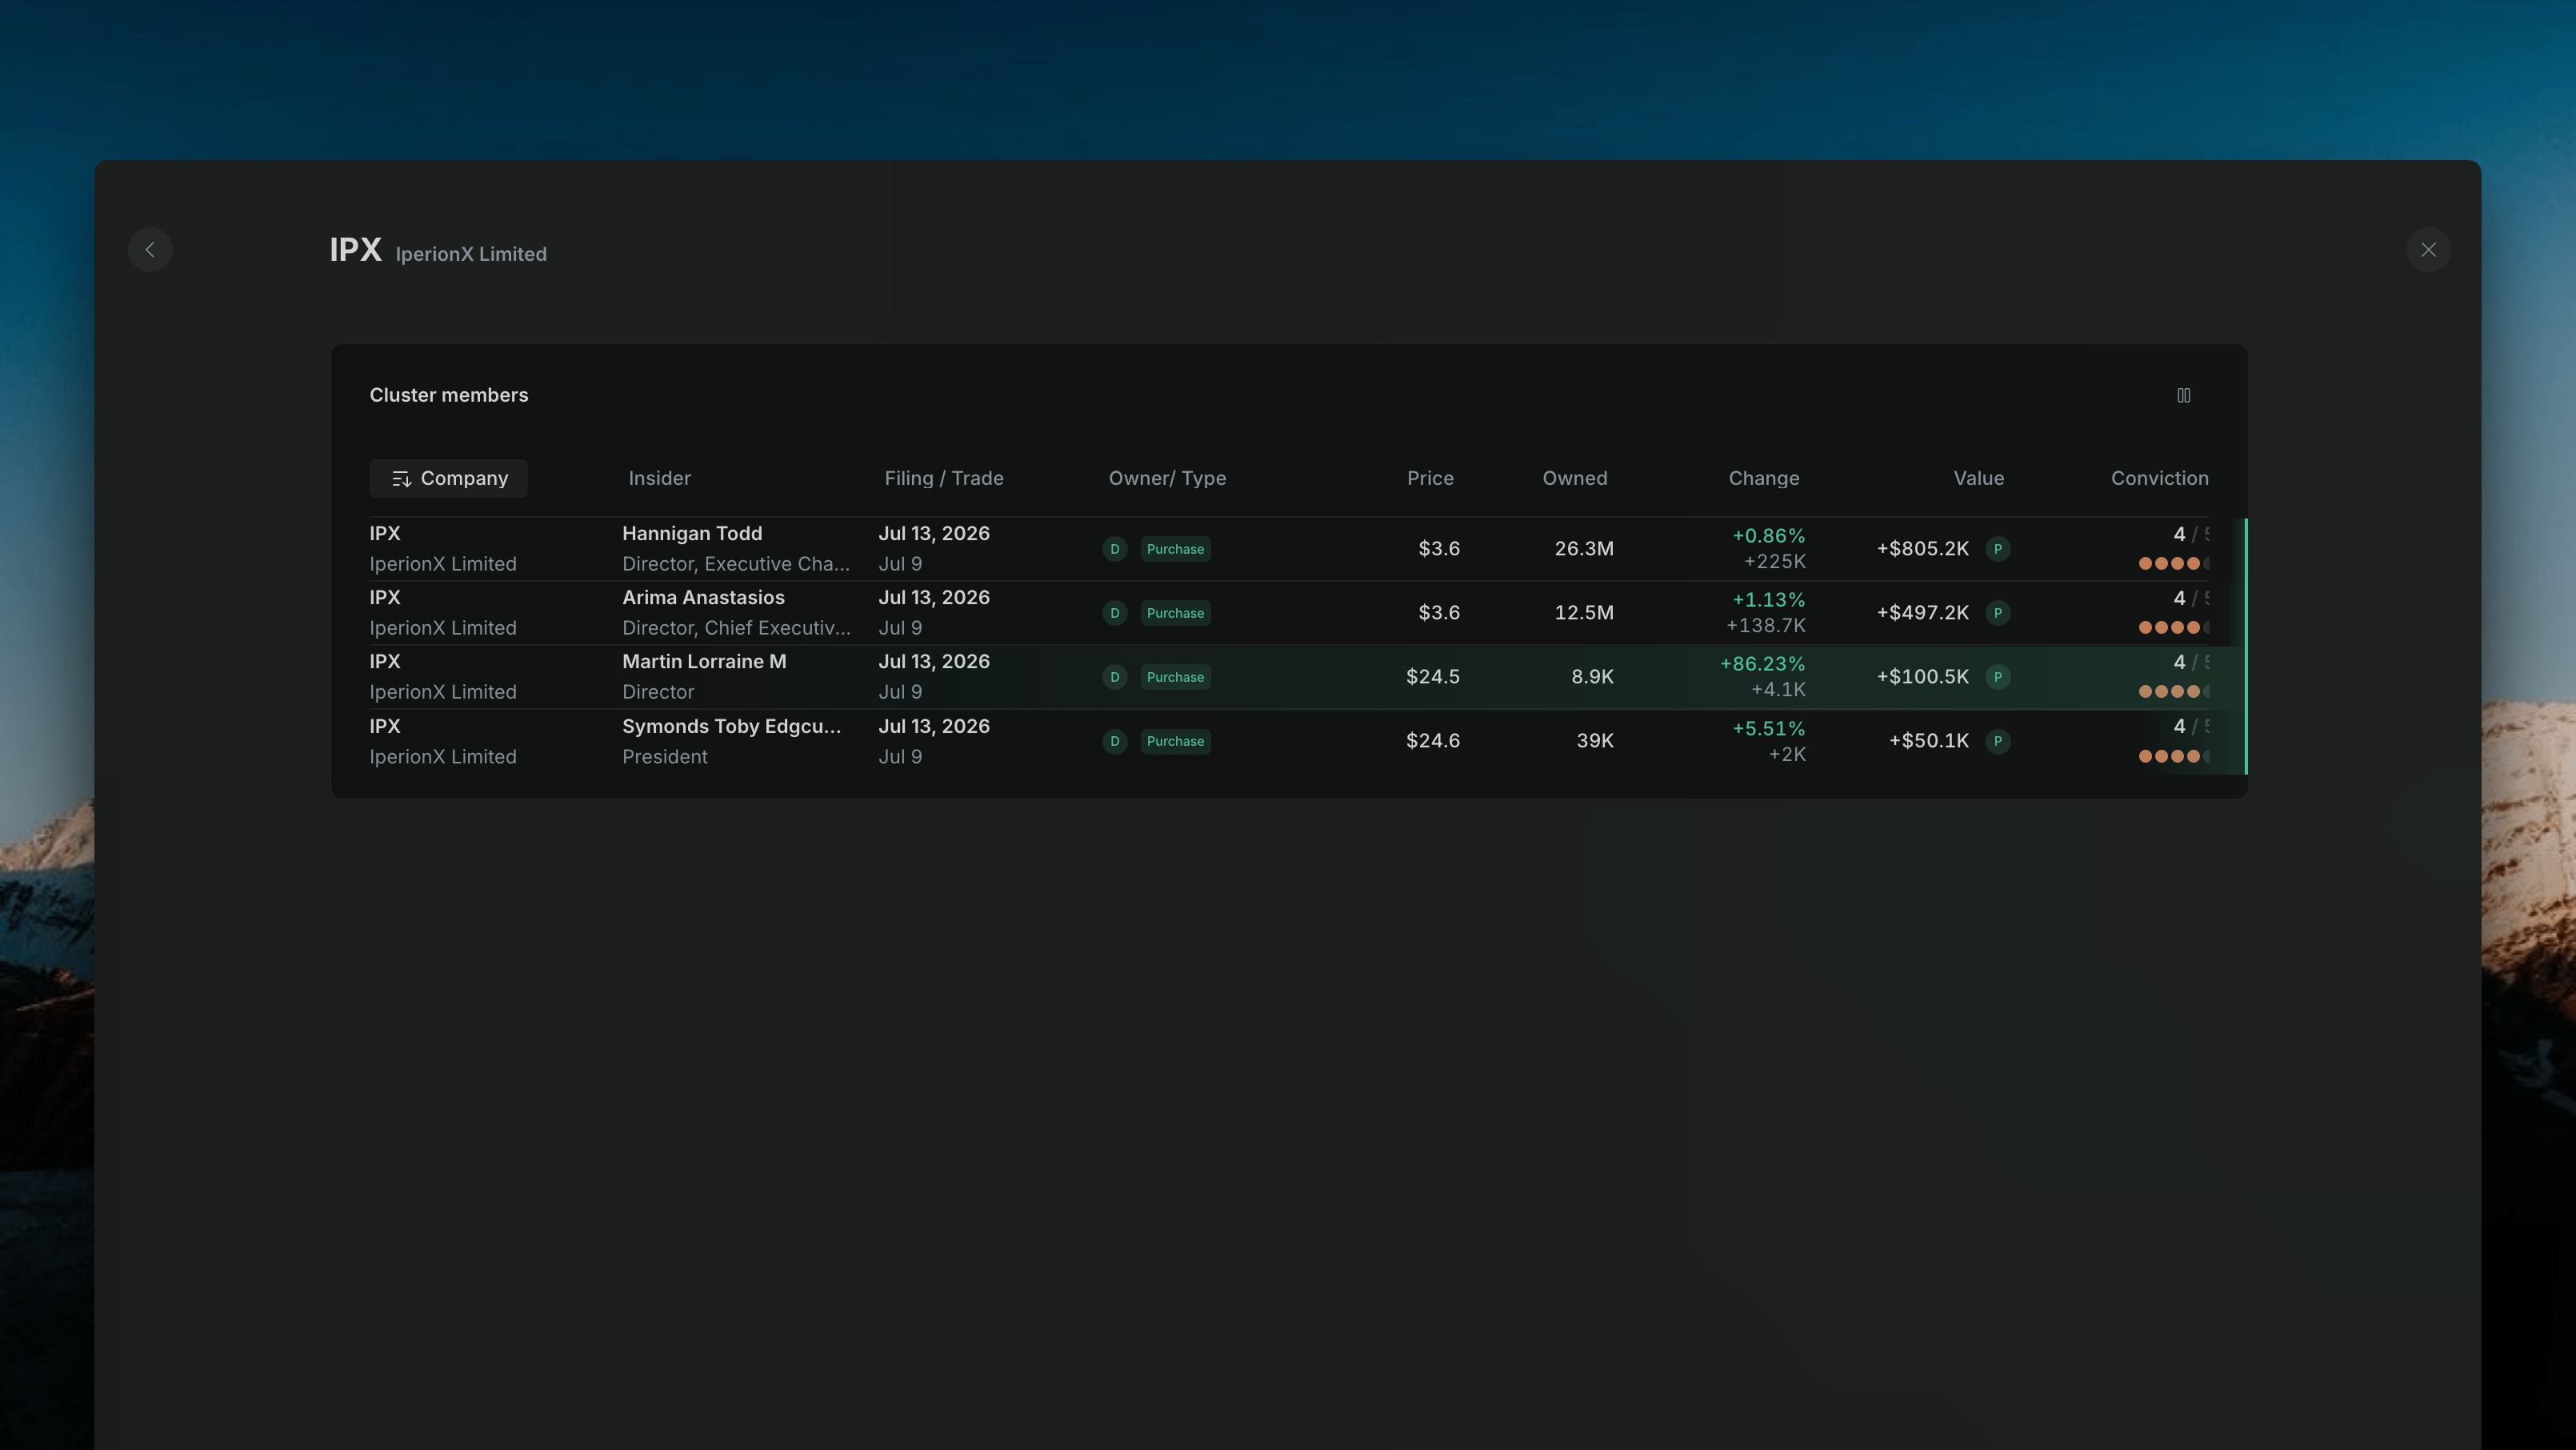 Closing the overlay returns you to exactly where you were on the Charts view — there's no page redirect or lost scroll position.
## Related topics
- [Filter View](/insider-trades/filter-view.md)
- [How to Research Any Public Stock Using Insighthread](/guides/research-a-stock.md)
- [Company Profiles: Deep Research on Any Public Stock](/features/company-profiles.md)
- [Historical Financial Data for 6,000+ Public Companies](/features/financials.md)
- [Presentations Filter](/home/presentations-filter.md)
Closing the overlay returns you to exactly where you were on the Charts view — there's no page redirect or lost scroll position.
## Related topics
- [Filter View](/insider-trades/filter-view.md)
- [How to Research Any Public Stock Using Insighthread](/guides/research-a-stock.md)
- [Company Profiles: Deep Research on Any Public Stock](/features/company-profiles.md)
- [Historical Financial Data for 6,000+ Public Companies](/features/financials.md)
- [Presentations Filter](/home/presentations-filter.md)