> ## Documentation Index
> Fetch the complete documentation index at: https://docs.insighthread.com/llms.txt
> Use this file to discover all available pages before exploring further.
# Overview
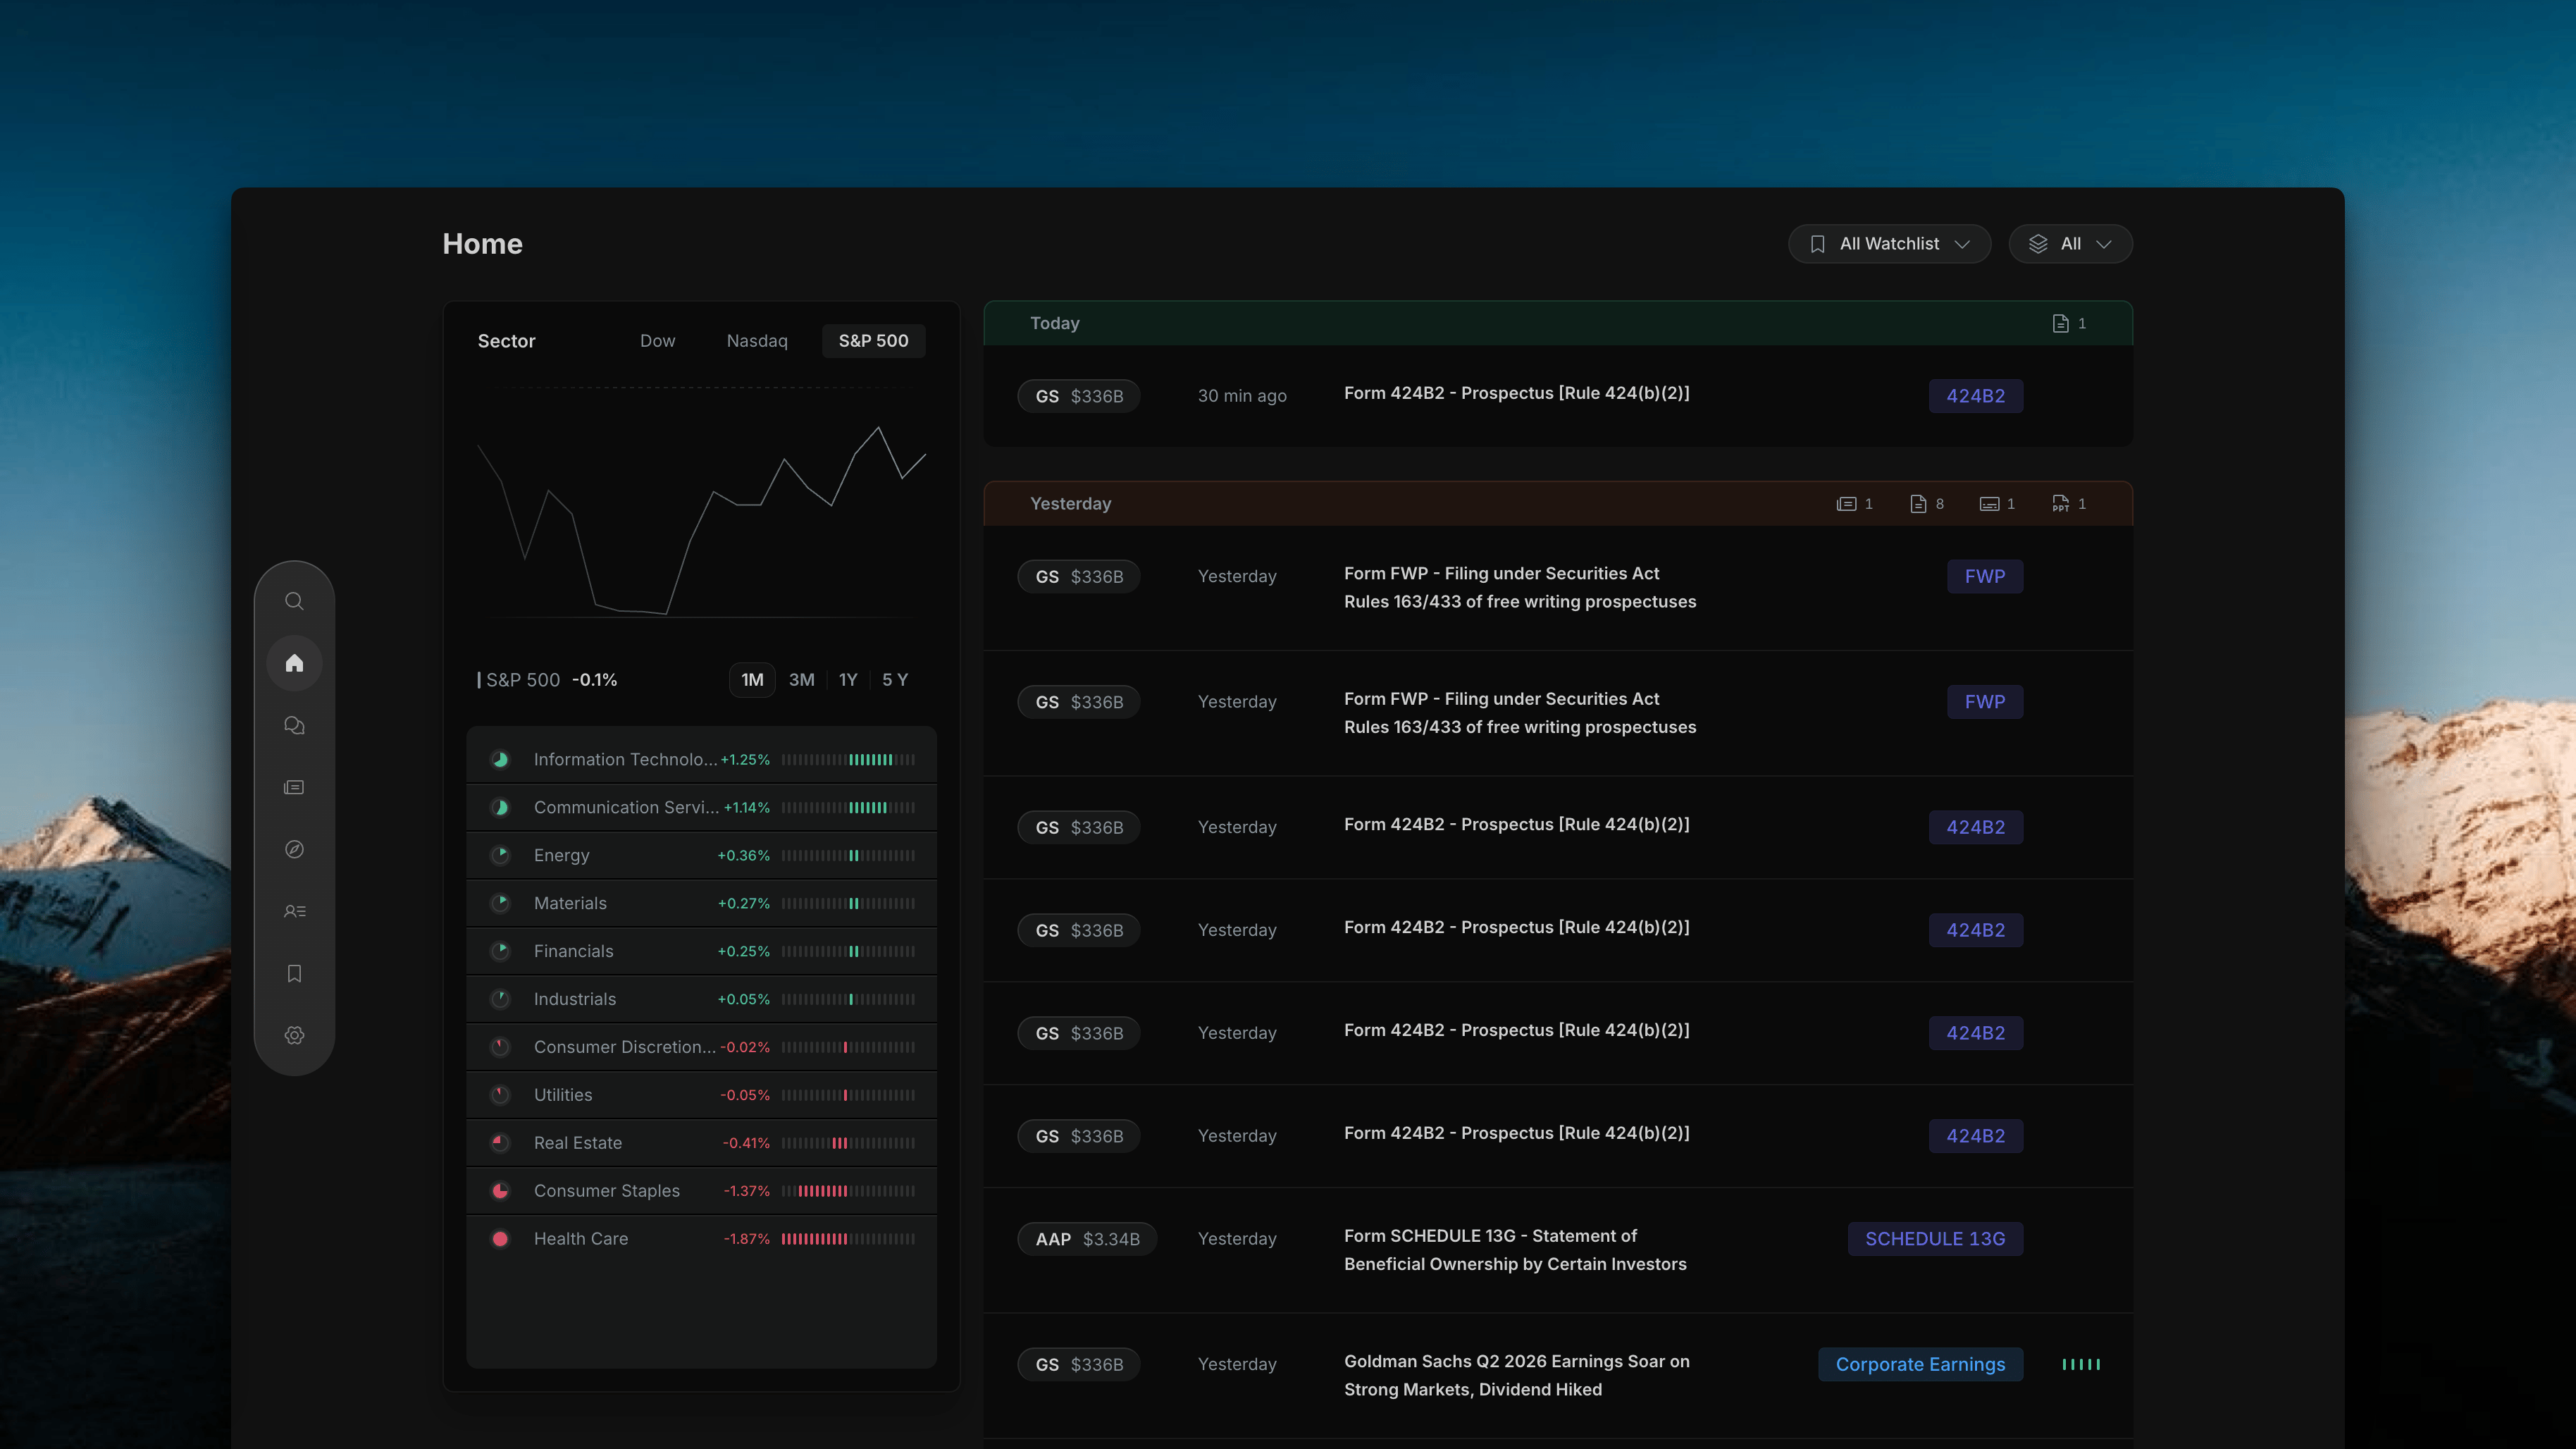
The Home page is the first thing you see after logging in. It gives you a live stream of everything happening across your watchlisted stocks — news events, SEC filings, earnings transcripts, and presentations — grouped by date so the most recent activity is always at the top.
 ***
## Page Layout
The page is split into two panels side by side:
Index performance chart with a sector breakdown list. Gives you broader market context alongside your watchlist activity.
A live stream of news and filings for your watchlisted stocks, grouped by date. Each row shows the ticker, market cap, time, headline, and a type badge.
***
## Left Panel
The left panel has two parts stacked vertically.
***
## Page Layout
The page is split into two panels side by side:
Index performance chart with a sector breakdown list. Gives you broader market context alongside your watchlist activity.
A live stream of news and filings for your watchlisted stocks, grouped by date. Each row shows the ticker, market cap, time, headline, and a type badge.
***
## Left Panel
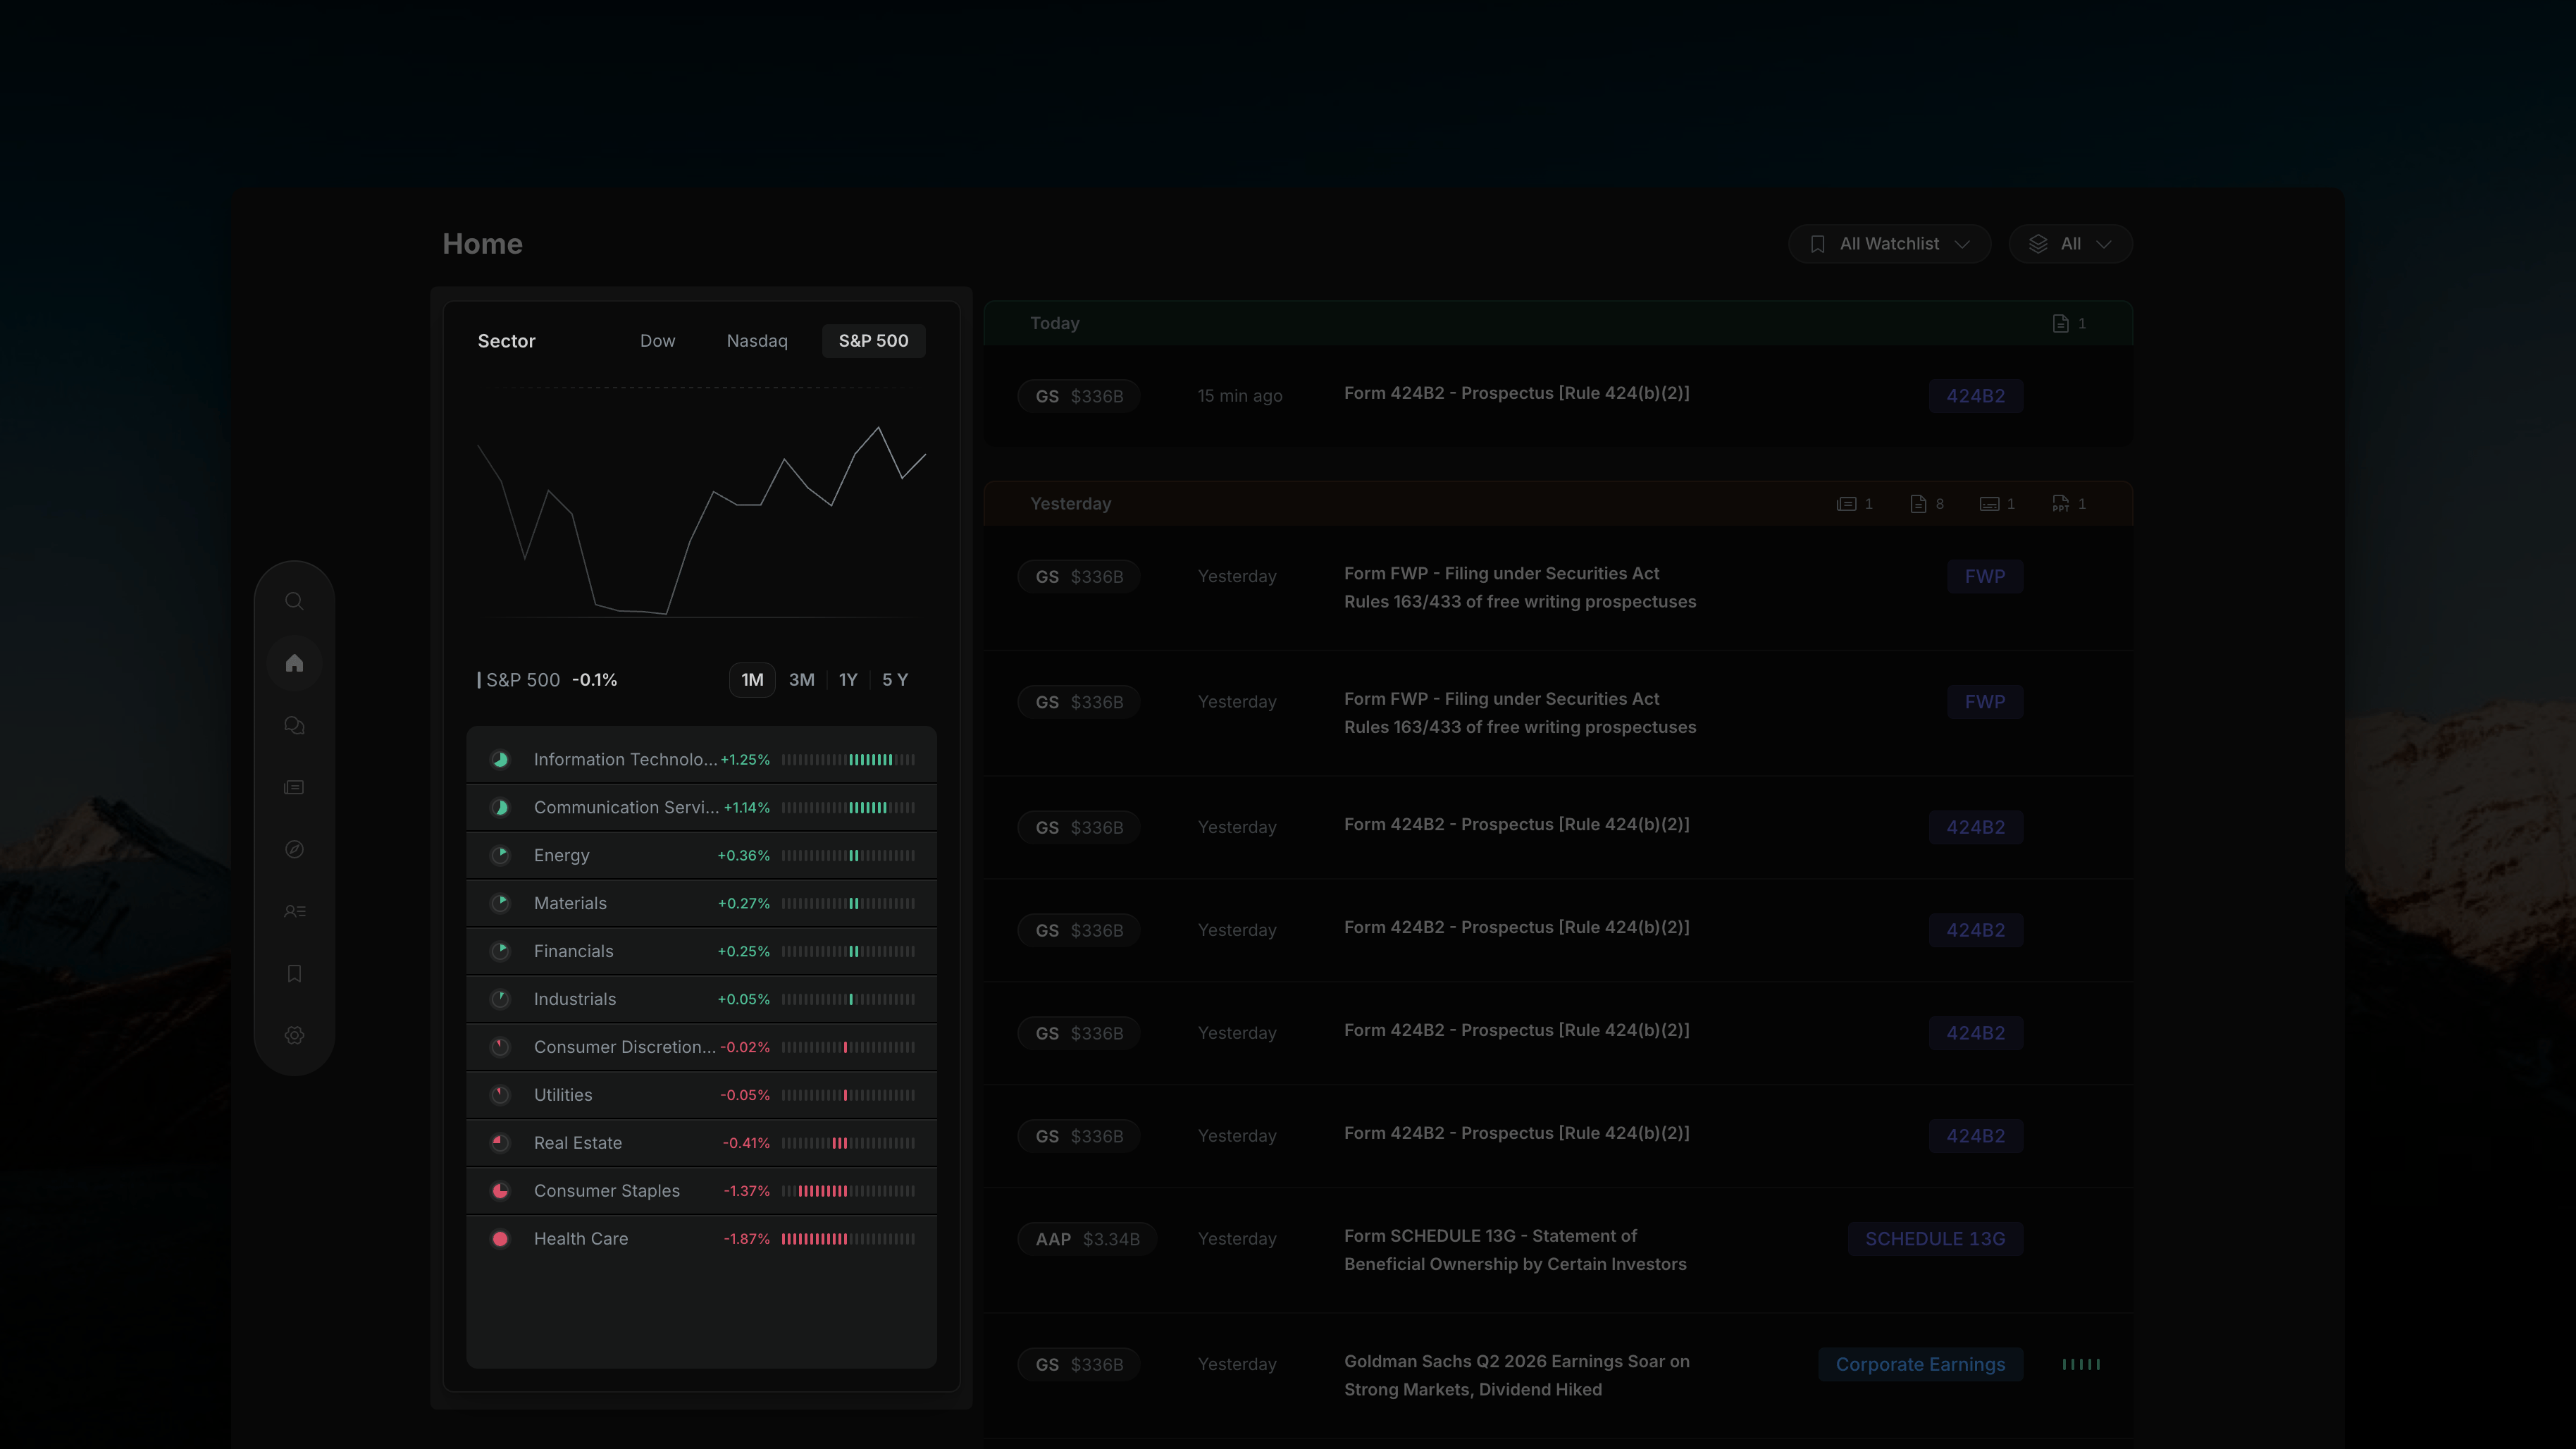
The left panel has two parts stacked vertically.
 ### Index Chart (Top)
At the top of the panel, three tabs let you choose which index to plot — **Dow**, **Nasdaq**, or **S\&P 500**. The selected index is highlighted (e.g. S\&P 500) and its current return is shown below the chart (e.g. "S\&P 500 −0.1%").
Use the timeframe buttons to change the chart window:
| Button | Period |
| ------ | -------- |
| 1M | 1 Month |
| 3M | 3 Months |
| 1Y | 1 Year |
| 5Y | 5 Years |
### Sector Performance List (Bottom)
Below the chart, all 11 GICS sectors are listed with their percentage change for the selected timeframe. Each row has:
* A **colored dot** on the left (green = positive, red = negative)
* The **sector name**
* The **% change**
* A **horizontal bar** scaled to the magnitude of the move
Sectors are sorted from best to worst performer:
| Sector | Performance |
| ---------------------- | ----------- |
| Information Technology | +1.25% |
| Communication Services | +1.14% |
| Energy | +0.36% |
| Materials | +0.27% |
| Financials | +0.25% |
| Industrials | +0.05% |
| Consumer Discretionary | −0.02% |
| Utilities | −0.05% |
| Real Estate | −0.41% |
| Consumer Staples | −1.37% |
| Health Care | −1.87% |
The sector list recalculates whenever you change the timeframe — switching from 1M to 1Y updates all sector returns for that window.
***
## Right Panel — Activity Feed
The feed shows a live stream of events for your watchlisted stocks, grouped by date.
### Index Chart (Top)
At the top of the panel, three tabs let you choose which index to plot — **Dow**, **Nasdaq**, or **S\&P 500**. The selected index is highlighted (e.g. S\&P 500) and its current return is shown below the chart (e.g. "S\&P 500 −0.1%").
Use the timeframe buttons to change the chart window:
| Button | Period |
| ------ | -------- |
| 1M | 1 Month |
| 3M | 3 Months |
| 1Y | 1 Year |
| 5Y | 5 Years |
### Sector Performance List (Bottom)
Below the chart, all 11 GICS sectors are listed with their percentage change for the selected timeframe. Each row has:
* A **colored dot** on the left (green = positive, red = negative)
* The **sector name**
* The **% change**
* A **horizontal bar** scaled to the magnitude of the move
Sectors are sorted from best to worst performer:
| Sector | Performance |
| ---------------------- | ----------- |
| Information Technology | +1.25% |
| Communication Services | +1.14% |
| Energy | +0.36% |
| Materials | +0.27% |
| Financials | +0.25% |
| Industrials | +0.05% |
| Consumer Discretionary | −0.02% |
| Utilities | −0.05% |
| Real Estate | −0.41% |
| Consumer Staples | −1.37% |
| Health Care | −1.87% |
The sector list recalculates whenever you change the timeframe — switching from 1M to 1Y updates all sector returns for that window.
***
## Right Panel — Activity Feed
The feed shows a live stream of events for your watchlisted stocks, grouped by date.
 ### Date Group Headers
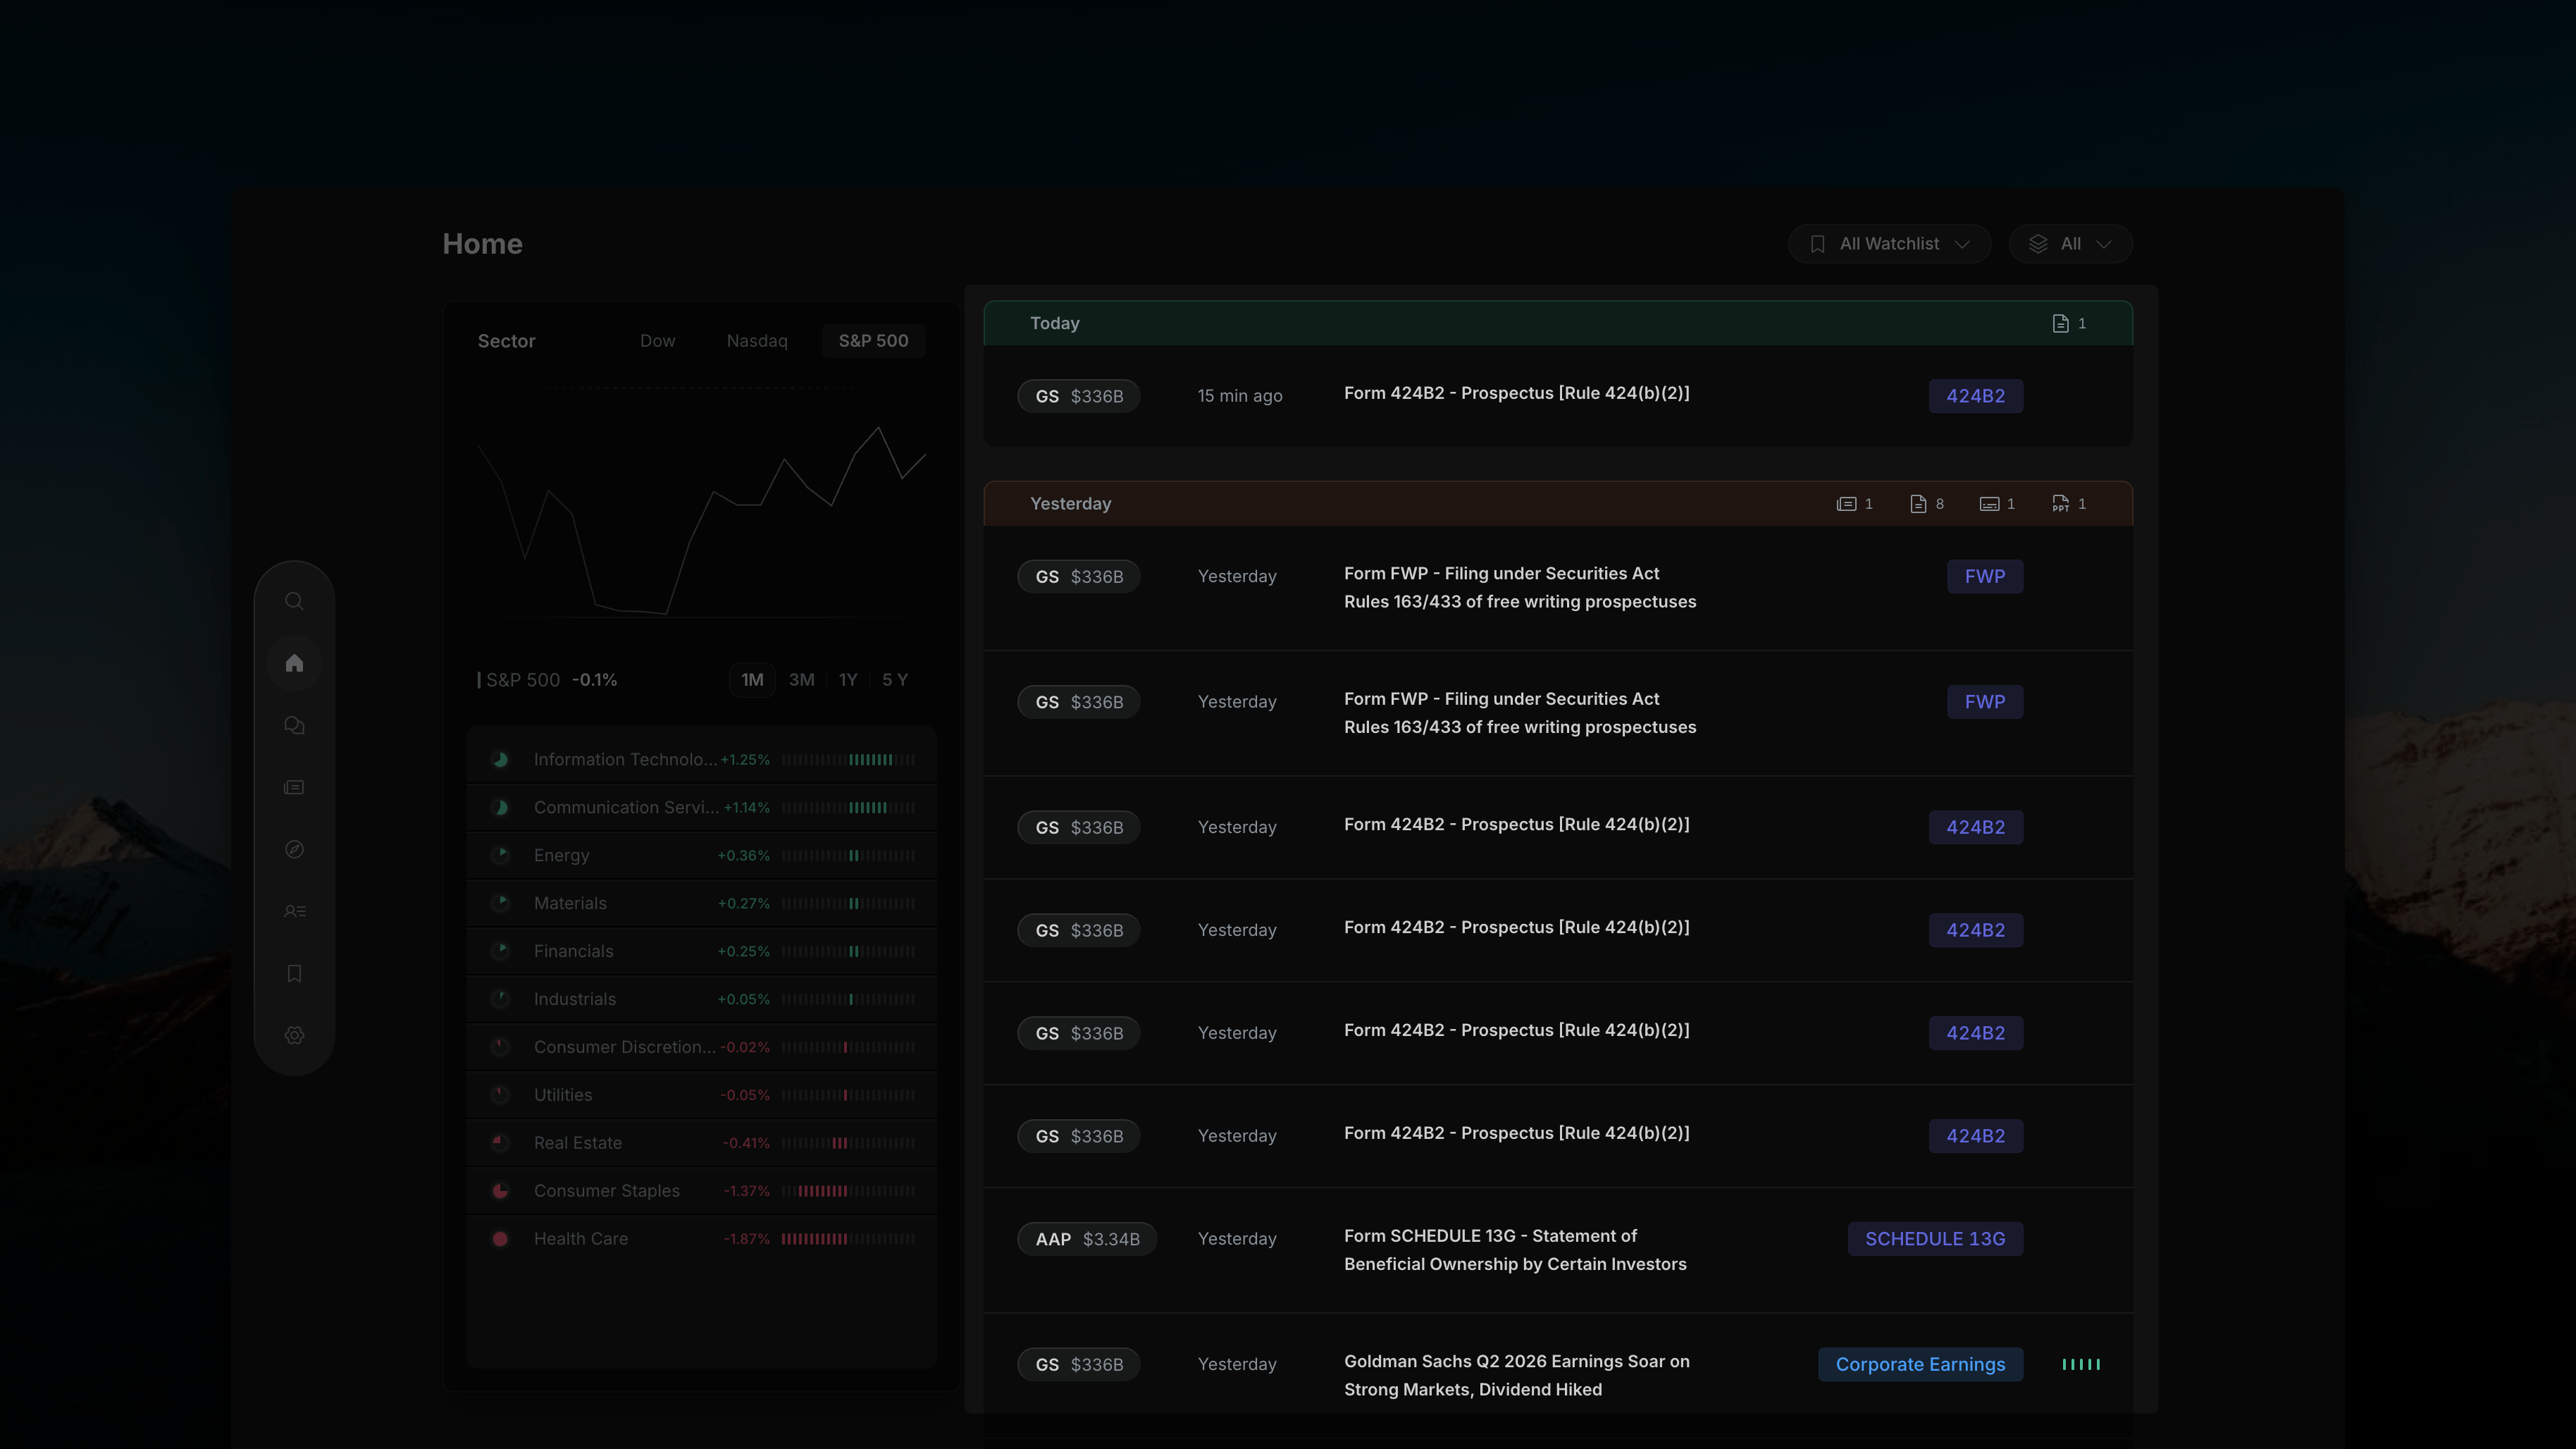
Each group (e.g. **Today**, **Yesterday**) has a header bar with small icon badges on the right showing a count for each content type available in that time window:
| Icon | Content Type |
| ---- | ------------- |
| 📰 | News items |
| 📄 | SEC Filings |
| 📋 | Transcripts |
| 🎯 | Presentations |
These counts are always visible regardless of which type filter is active — so you can see what's available in any time window at a glance.
### Each Row
Every row in the feed contains:
| Element | Description |
| ---------------- | ------------------------------------------------------------------------------------- |
| **Ticker badge** | Stock ticker + market cap (e.g. `GS $336B`, `AAP $3.34B`) |
| **Time** | How long ago the event appeared (e.g. "15 min ago", "Yesterday") |
| **Headline** | News headline or the SEC form name (e.g. "Form 424B2 — Prospectus \[Rule 424(b)(2)]") |
| **Type badge** | Color-coded label — e.g. `424B2`, `FWP`, `SCHEDULE 13G`, `Corporate Earnings` |
| **Impact bars** | 5-bar green/red signal shown only on news rows |
### Row Types in the Feed
The feed contains two distinct types of rows, often appearing together for the same company event:
Shows the raw SEC document — form name and items (e.g. "Form 8-K − Current report − Item 2.02 Item 9.01"). Badge shows the form type (e.g. `8-K`, `424B2`, `FWP`, `SCHEDULE 13G`). No impact bars.
A plain-English summary auto-generated from the filing (e.g. "Goldman Sachs Q2 2026 Earnings Soar on Strong Markets, Dividend Hiked"). Badge shows the event category (e.g. `Corporate Earnings`). Includes a 5-bar impact signal.
The market cap next to each ticker (e.g. `GS $336B` vs `AAP $3.34B`) helps you instantly judge significance — the same event category reads very differently at a $336B company vs a $3B one.
***
## Top Controls
Two controls in the top-right corner scope the entire feed. These are covered in detail in the next sections:
* [**All Watchlist**](/home/watchlist-filter) — filter the feed to specific watchlists
* [**All**](/home/news-filter) — filter by content type (News, SEC Filings, Transcript, Presentations)
## Related topics
- [Overview](/news/overview.md)
- [API Authentication — Insighthread News API Bearer Tokens](/api/authentication.md)
- [Insighthread News API: All Event Categories Reference](/api/event-categories.md)
- [Insighthread News API: Real-Time SEC Event Intelligence](/api/overview.md)
- [Company Profiles: Deep Research on Any Public Stock](/features/company-profiles.md)
### Date Group Headers
Each group (e.g. **Today**, **Yesterday**) has a header bar with small icon badges on the right showing a count for each content type available in that time window:
| Icon | Content Type |
| ---- | ------------- |
| 📰 | News items |
| 📄 | SEC Filings |
| 📋 | Transcripts |
| 🎯 | Presentations |
These counts are always visible regardless of which type filter is active — so you can see what's available in any time window at a glance.
### Each Row
Every row in the feed contains:
| Element | Description |
| ---------------- | ------------------------------------------------------------------------------------- |
| **Ticker badge** | Stock ticker + market cap (e.g. `GS $336B`, `AAP $3.34B`) |
| **Time** | How long ago the event appeared (e.g. "15 min ago", "Yesterday") |
| **Headline** | News headline or the SEC form name (e.g. "Form 424B2 — Prospectus \[Rule 424(b)(2)]") |
| **Type badge** | Color-coded label — e.g. `424B2`, `FWP`, `SCHEDULE 13G`, `Corporate Earnings` |
| **Impact bars** | 5-bar green/red signal shown only on news rows |
### Row Types in the Feed
The feed contains two distinct types of rows, often appearing together for the same company event:
Shows the raw SEC document — form name and items (e.g. "Form 8-K − Current report − Item 2.02 Item 9.01"). Badge shows the form type (e.g. `8-K`, `424B2`, `FWP`, `SCHEDULE 13G`). No impact bars.
A plain-English summary auto-generated from the filing (e.g. "Goldman Sachs Q2 2026 Earnings Soar on Strong Markets, Dividend Hiked"). Badge shows the event category (e.g. `Corporate Earnings`). Includes a 5-bar impact signal.
The market cap next to each ticker (e.g. `GS $336B` vs `AAP $3.34B`) helps you instantly judge significance — the same event category reads very differently at a $336B company vs a $3B one.
***
## Top Controls
Two controls in the top-right corner scope the entire feed. These are covered in detail in the next sections:
* [**All Watchlist**](/home/watchlist-filter) — filter the feed to specific watchlists
* [**All**](/home/news-filter) — filter by content type (News, SEC Filings, Transcript, Presentations)
## Related topics
- [Overview](/news/overview.md)
- [API Authentication — Insighthread News API Bearer Tokens](/api/authentication.md)
- [Insighthread News API: All Event Categories Reference](/api/event-categories.md)
- [Insighthread News API: Real-Time SEC Event Intelligence](/api/overview.md)
- [Company Profiles: Deep Research on Any Public Stock](/features/company-profiles.md)